Home Blog

Zwift Racing Powered By DURA-ACE Series Announced for September 2026

0

Zwift Racing Powered By DURA-ACE Series Announced for September 2026

Zwift’s “ZRacing” is the platform’s most popular ongoing race series, and beginning in September, Zwift is placing it under the “Zwift Racing” umbrella. Moving forward, expect each monthly series to include ZRacing, Crit Club, Epic Race Club, and TT Club events.

This means each week’s offers races in four formats. Completing any of the four earns you an XP bonus and credit for the stage. Read on for details!

New This Month

DURA-ACE Features and Prize Draw

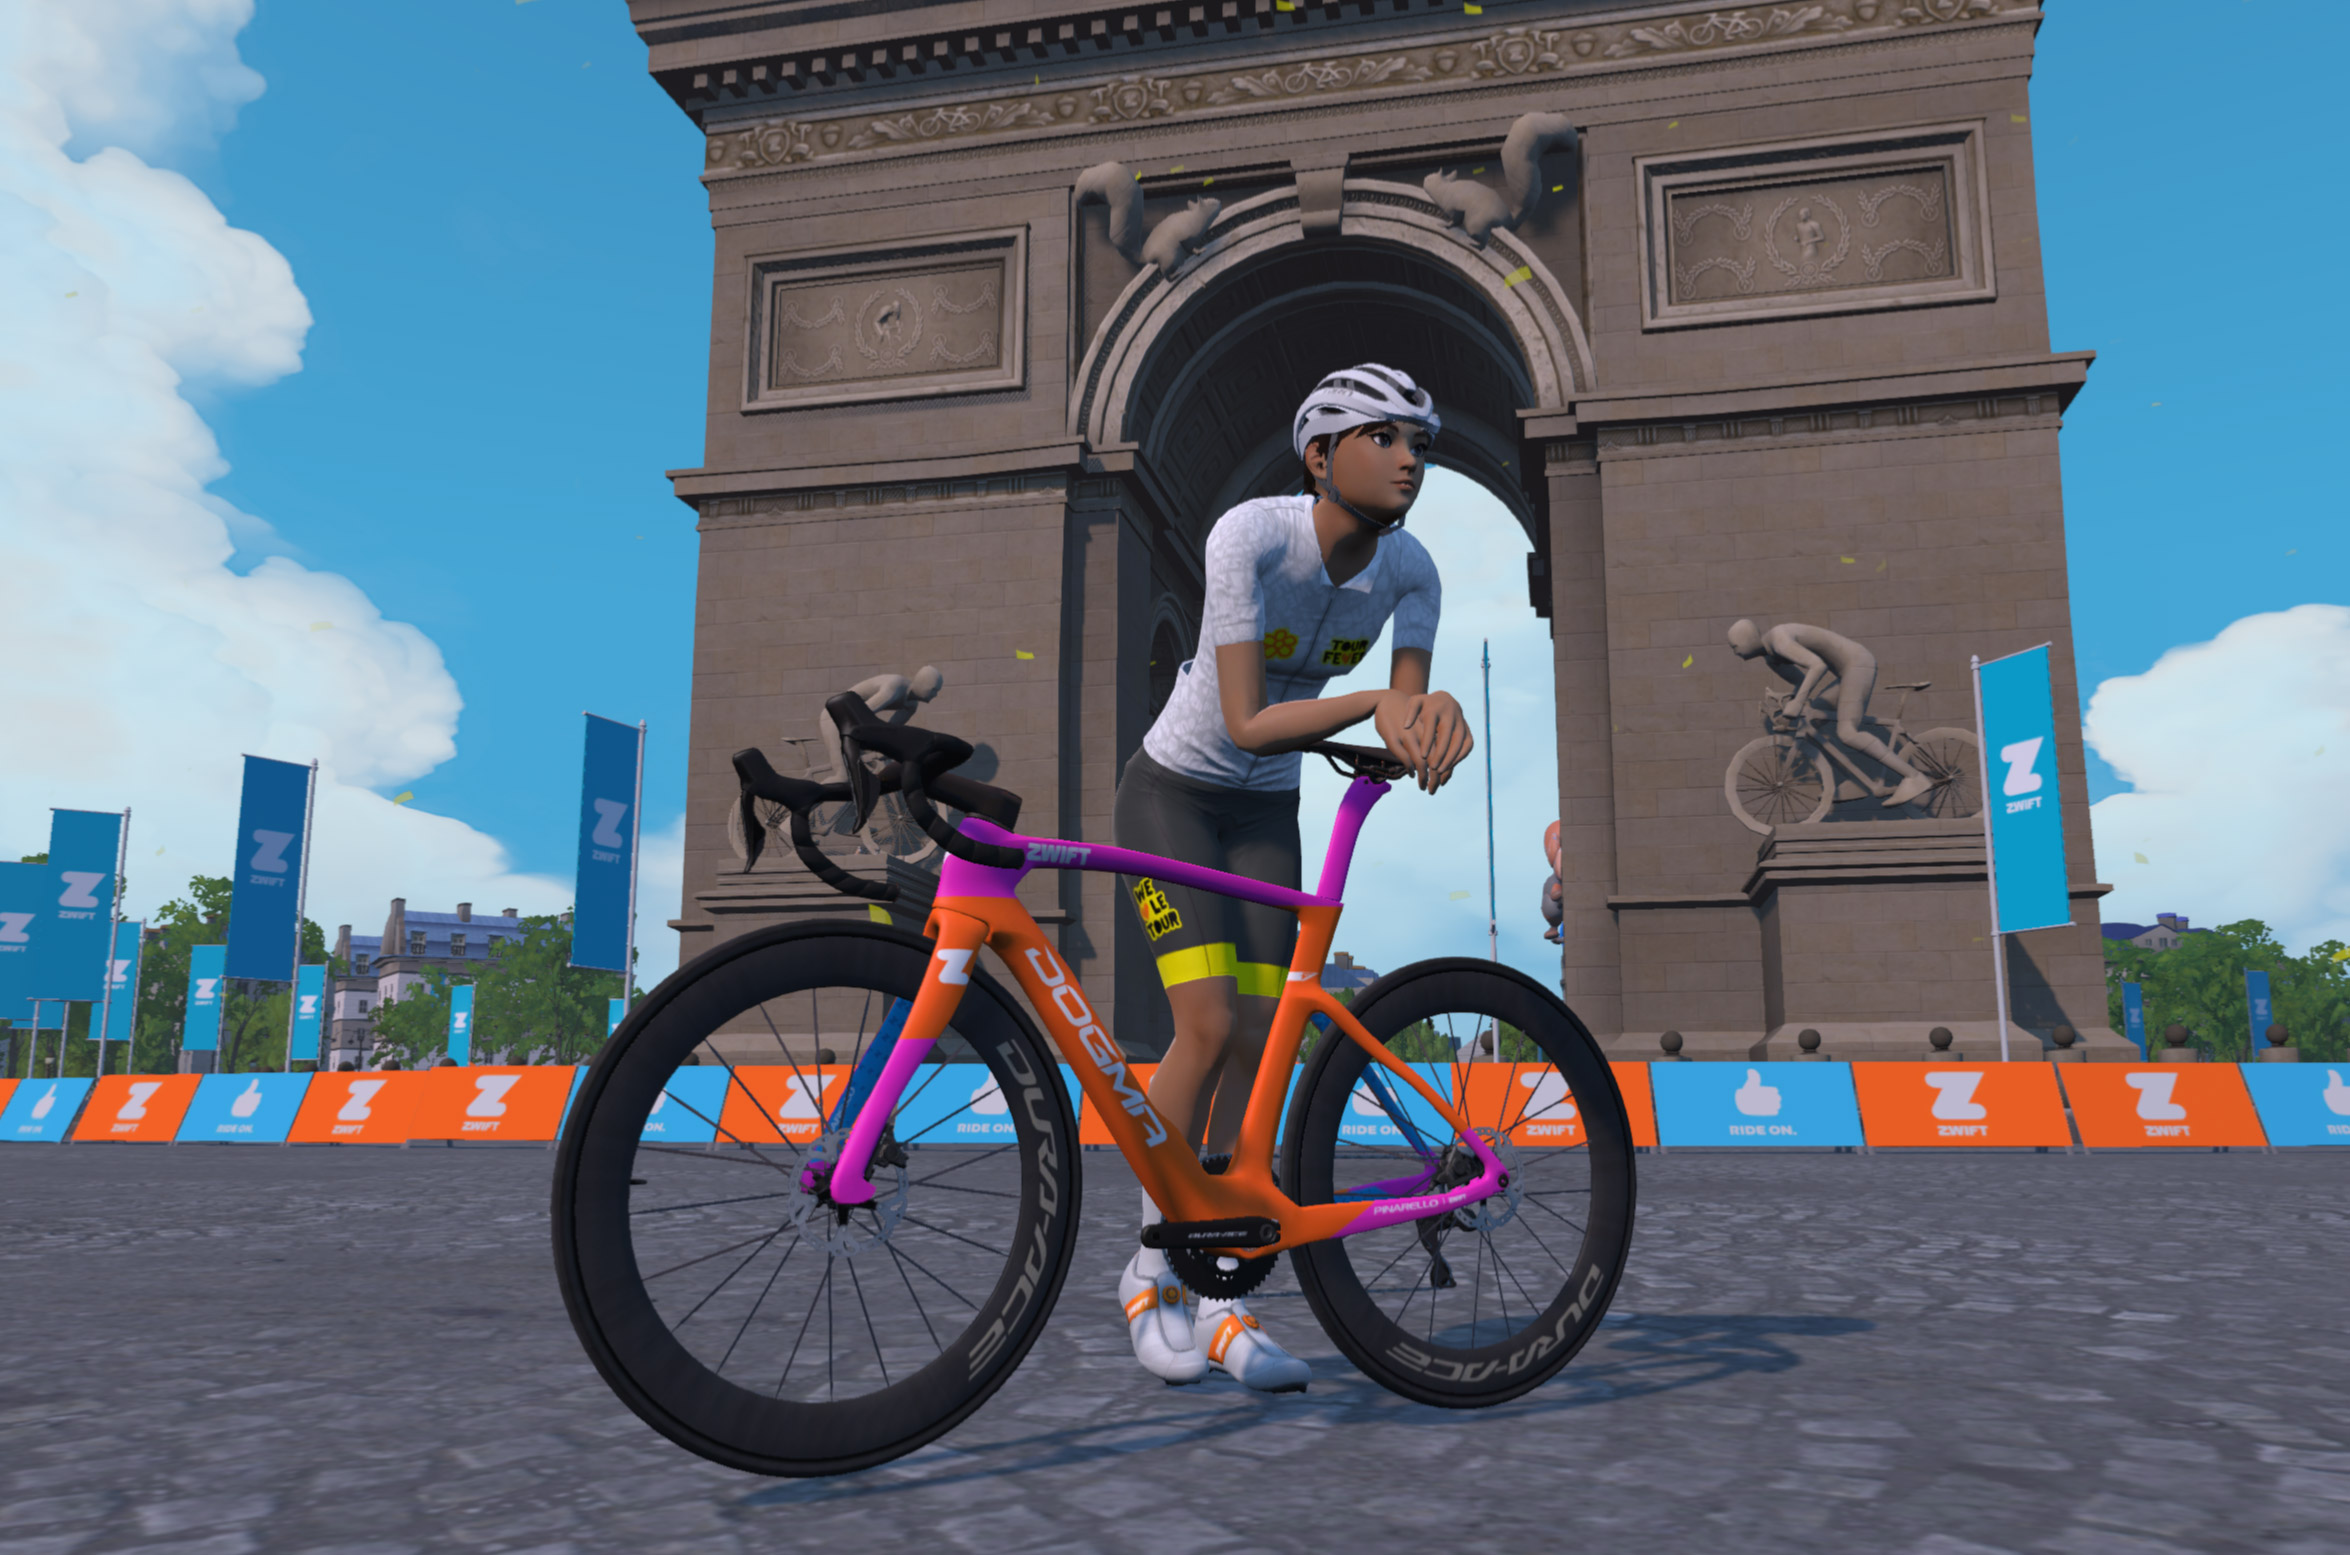
Each race of this series puts riders on one of the fast new Shimano DURA-ACE wheelsets. The C99/Disc is used for all the time trials, while the C50 and C60 are used for most of the other races, with the lighter C36 featuring only in week 4’s ZRacing event.

Related: All About the New Shimano Dura-Ace Wheelsets in Zwift: C36, C50, C60, and C99/Disc >

Additionally, there’s a DURA-ACE unlock and giveaway! Complete any event of this series and you’ll also unlock the in-game DURA-ACE cycling cap. You’ll then receive an email (if you’re opted into emails from Zwift) with details on how to enter the Shimano giveaway, with the chance to win:

  • One of 100 Shimano DURA-ACE baseball caps
  • 1 set of DURA-ACE C50 wheels

Entry and prize fulfilment are administered by Shimano. Full eligibility and terms and conditions will be provided by Shimano.

Racing 101

For riders who want to get familiar with racing before jumping into an event, new Zwift Racing: Racing 101 events offer a guided introduction to the basics. Learn key racing skills in a group ride, then put them into practice when you’re ready to take on your first race.

Sign up at zwift.com/events/tag/zwiftracing101 >

September’s Routes

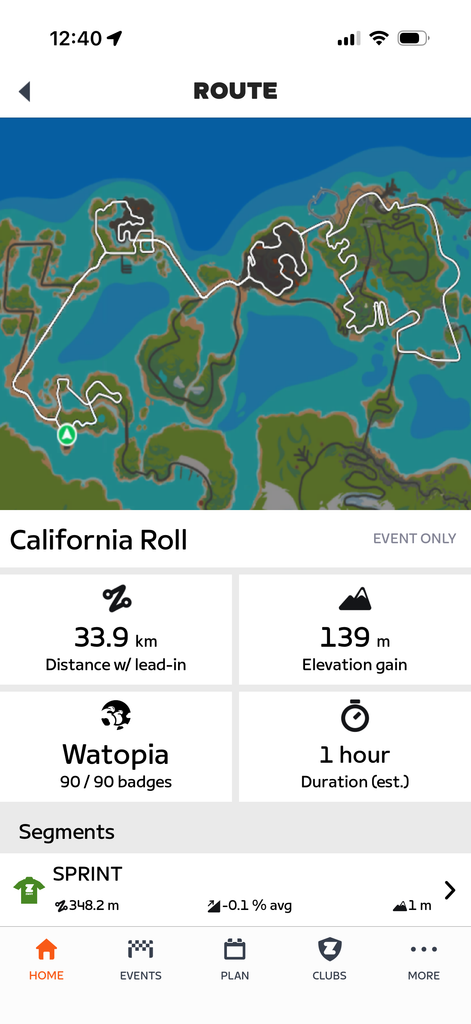
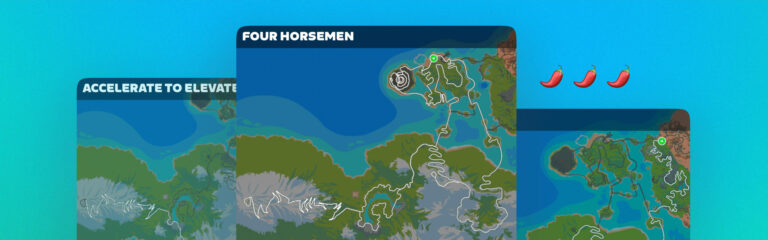
Here are the routes we’ll be racing in this month’s series:

See Women-Only Zwift Racing events >
See Range 1 Zwift Racing events >
See Range 2 Zwift Racing events >
See Advanced Zwift Racing events >
See ALL Zwift Racing events >

Bonus XP

You’ll earn a chunk of XP for each stage you complete, including 1000 XP for your first stage! Total XP for completing all four stages is 2000 XP (1000 XP for first stage, +500 for two stages, +300 for three stages, +200 for four stages).

Post-Race Analysis

GC Leaderboard

Zwift’s web-based leaderboards track the monthly GC competition for ZRacing events. Access those leaderboards at zwift.com/racing/leagues/zracingsep2026.

Monthly GC leagues are also available for the Crit, Epic, and TT races. These can be found at ZwiftPower>Leagues.

Your GC ranking is based on your best finishing time for each stage, and you can race stages more than once to try for a better time.

Your Racing Profile

In May, Zwift launched the new “Racing Profile Page” at zwift.com, bringing all your Zwift race results together in one place so it’s easier to track performance and results etc. This page continues to be built out, including the addition of a power dashboard (see below). Sources tell me a ZRS history chart is arriving very soon!

Your profile is available at zwift.com/racing/me.

Category Options

In addition to the Crit, Epic, and TT races, Zwift now schedule four different flavors of ZRacing events in order to encourage “Fairer, more competitive racing for everyone.” Click banners below to see upcoming events for each:

Questions or comments?

Post below! 


Tiny Race Series – September 5 Routes – Getting Longer

0

Tiny Race Series – September 5 Routes – Getting Longer

See zwiftinsider.com/tiny for current Tiny Race details.


Level Hill Climb Series Announced, Beginning September 10

8

Level Hill Climb Series Announced, Beginning September 10

Are you a strong climber? Level Racing recently announced the Level Hill Climb Series – a series of five races focused entirely on particular climb segments. Read on for details!

How It Works

This is a series of five points races where points are scored for FTS (fastest through segment) on a hill climb KOM segment near the start pen of each race. Maximum points for a segment is 100, down to 1. Only the KOM segment scores in each race. Nothing else matters!

Drafting is disabled, so this is a pure test of a rider’s climbing ability. But you can pick your best climbing bike/wheels setup.

Related: Fastest Climbing Bike Frames and Wheels at Each Zwift Level >

Your best three races of the five will count toward your overall series finish.

Event results and league positions will be published on ZwiftPower. Results are combined for all events, regardless of which time slot you race.

See results on ZwiftPower >

Riders are categorized based on zFTP, but everyone leaves the pens at the same time.

Thursday Time Slots

Races are on five consecutive Thursdays beginning September 10. There are three different time slots for maximum availability:

  • 10:35am UTC/6:35am ET/3:35am PT
  • 6:25pm UTC/2:25pm ET/11:25am PT
  • 11:35pm UTC/7:35pm ET/4:35pm PT

Routes and KOM Segments

Sign Up

Sign up at zwift.com/events/tag/levelhillclimb >


JetBlack VICTORY Frame Announced: a Zwift Ride Competitor from Down Under?

23

JetBlack VICTORY Frame Announced: a Zwift Ride Competitor from Down Under?

Today, JetBlack Cycling unveiled the VICTORY Frame, their first-ever smartbike frame. Available as a standalone frame or bundled with JetBlack’s popular VICTORY trainer, it’s a direct competitor to Zwift’s Ride, and at a tempting price!

Key Features

  • Approximately 48–62 cm equivalent frame sizing (approximate rider heights: 5’1″ to 6’4″)
  • Extensive saddle, stack and reach adjustment
  • Adjustable crank length (165mm, 170mm, 172.5mm)
  • Aerobar compatible
  • Road, endurance, time trial and triathlon positioning
  • Designed to replicate real-bike fit
  • Suitable for multiple riders
  • Compatible with Zwift Ready smart trainers
  • Integrated fit for Zwift Click 1 and Click 2 controllers
  • Designed for Zwift and ROUVY experiences
  • Indoor Cycling Ergonomics Guide included
  • Free bike setup guidance in JetBlack App
  • Two bottle cages and integrated removable trainer tray for ride essentials
  • Stable steel construction

Pricing and Availability

  • Standalone Victory FRAME: $649USD, €799, £599, $1,099AU
  • Victory Frame Bundled with VICTORY Trainer: $999USD, €999, £899, $1,699AU

You can currently register your VICTORY Frame interest on JetBlack’s site. Presales will begin in October for end-of-November deliveries.

VICTORY vs Zwift Ride

Of course, the VICTORY Frame will draw direct comparisons to the wildly popular Zwift Ride. The frames share more similarities than differences, since they’re both made to be durable, affordable frames that pair nicely with Zwift Ready smart trainers.

But how are they different? We don’t have the VICTORY frame yet in-house, so we can’t yet make a complete comparison to the Zwift Ride frame. But there are several clear differences:

  • Controllers: the Zwift Ride uses Play-like controllers integrated into the handlebar, while the VICTORY Frame is made to fit nicely with Zwift’s Click v1 and v2 controllers, which aren’t included in the purchase of the standalone frame.
  • Handlebar Options: the difference in controllers means Zwift Ride users are stuck with a standard handlebar setup, although clip on TT bars could be added. VICTORY Frame users could swap in any bars they’d like, since the Click controllers can be used in almost any configuration.
  • Saddle Setback Adjustability: the VICTORY Frame wins here, with a dedicated rail allowing major saddle setback adjustments.
  • Bottom Bracket: another VICTORY Frame win, as it uses a standard threaded Shimano external bottom bracket interface, allowing owners to service the BB and swap in their own cranks if desired. (The VICTORY frame uses 16-notch bearing cups and a 44mm outside diameter compatible with Park Tool BBT-9, BBT-19.2 and BBT-69 / BBT69.2 installation tools. Cranks are press fit.)
  • Adjustable Crank Length: the VICTORY Frame ships with a 3-position bear claw crank, while the Zwift Ride ships with a 170mm cranks. (Zwift sells 5-position adjustable crank arms for $99.)
  • Stated Rider Size Range: this is an approximation, of course, but the Zwift Ride comes out ahead with a stated rider size of 5′-6’6″, while JetBlack tells me the VICTORY Frame fits 5’1″-6’4″.
  • Rocker Feet: the VICTORY Frame is compatible with JetBlack’s Freedom Rocker Feet, allowing for some side-to-side movement.
  • Pricing: the VICTORY Frame is priced lower than the Zwift Ride, both as a standalone frame and a frame+trainer bundle.
    • Standalone Victory FRAME: $649USD, €799, £599, $1,099AU
    • Standalone Zwift Ride: $799.99USD, €799, £749, $1,400AU
    • Victory Frame Bundled with VICTORY Trainer: $999USD, €999, £899, $1,699AU
    • Zwift Ride bundled with Wahoo KICKR CORE v2 Trainer: USA: $1299USD, €1199, £1099, $2,299AU

VICTORY vs the Rest

While the VICTORY Frame’s biggest competitor will be the Zwift Ride, it’s also work comparing it to other indoor-only frames and smart bikes.

In the indoor-only frames sector, the only two competitors apart from the Zwift Ride are the Caveworks RIVET and Elite Square. The VICTORY Frame beats both on price and aesthetics, although the Elite Square has more features, and the RIVET may be a bit more accomodating to smaller riders or those wanting custom setups.

Compare the VICTORY Frame + Trainer bundle to a full smart bike setup, and you’ll see why smart bike sales have dropped substantially since the Zwift Ride’s release. Many riders find it difficult to justify dropping $4000US on a Wahoo KICKR Bike Pro or Tacx NEO Bike Plus when the Zwift Ride offers most of the same features for 1/3 the price. And now the VICTORY bundle is selling for even less? It’s a good time to be an indoor rider, friends. Especially in Australia and New Zealand, where the VICTORY bundle is priced $600AU lower than the Zwift Ride through Wahoo.

Development Timeline

According to JetBlack, the VICTORY Frame has been in the company’s product pipeline and design phase since 2020. The original idea was encouraged by JetBlack founder Tony Simmonds’ father, Victor “Vic” Simmonds, who questioned why riders should have to keep moving their outdoor bike on and off a trainer. That simple idea stayed with Tony.

Questions or comments?

You may want to see JetBlack’s VICTORY Frame page for more info. Share your questions and comments below!


Top 5 Zwift Videos: Level 100, Race Wins, and FTP Tests

Despite levels now extending far beyond level 100, reaching level 100 still remains one of the most coveted feats on Zwift. In this week’s top video, hear from one Zwifter as she shares her journey to level 100.

Also included in this week’s picks: winning Zwift races, completing FTP tests, improving max power, and racing duathlons on Zwift.

Team Saunders Tri explains what it takes to get to level 100 on Zwift and shares how she reached this coveted status.
After countless Zwift races, Crank and Cadence snags his first win. Watch as he breaks down the race.
Two weeks into his cycling journey, Will to Pedal tackles an FTP test.
Professional cyclist Tilly on a Bike provides commentary over her recent advanced Zwift race. Hear from her as she also shares some habits that helped her improve her max power.
Jessica Strange attempts her first duathlon on Zwift. Can she make it to the finish?

Got a Great Zwift Video?

Share the link below, and we may feature it in an upcoming post!

How Zwift Works: Time-Based Events, Differing Distances, and Steering Effectiveness

How Zwift Works: Time-Based Events, Differing Distances, and Steering Effectiveness

Even after several years of researching and writing about all things Zwift, there are still unanswered questions rattling around inside my head. Last week, I went to work answering a few of them:

  • Why does distance in the center HUD element not always match my distance in the rider list on the right?
  • How does Zwift actually measure distance?
  • Are the finishing distances shown in results actually accurate, particularly for time-based events like VO2sday, where the goal is to travel as far as possible in a given time?

Let’s go down the rabbit hole…

How Zwift Measures Distance

You might think that measuring and displaying distance is a simple proposition. But when you begin to ponder how routes and events and virtual riding actually work, you begin to realize there must be more to it.

Have you ever noticed that the distance figure in the center HUD element doesn’t always match the distance shown under your name in the rider list? Here’s a screenshot from a recent Pizza Burner ride I led – notice how the center HUD says I’ve ridden 91.3km, while the rider list says 91.2km:

You’ll see these two distance numbers diverge the longer your event is, and the more steering you do to take the optimal line. This is because the center HUD shows distance measured by one method, while the rider list shows distance measured by another:

  • Centerline Distance: calculated based on your location on course. This is the distance your avatar would travel if it stayed in the center of the lane for the entire ride. This is the distance shown in the center HUD for distance-based events like my screenshot above.
  • Wheel Rotation Distance: calculated (conceptually, at least) based on the actual rotations of your wheel. This is the distance your avatar has moved through space, regardless of direction. This is the distance shown in the rider list.

Once you understand how these two distance calculation methods differ, you can see why the two figures diverge as rides get longer and you steer onto the more optimal line. Steering an optimal line means your avatar actually travels a shorter distance to get from point A to point B than if it had stayed on the centerline. So as you get further into the event where you’re consistently steering onto the optimal line, the centerline figure (center HUD) will end up higher (never lower!) than your rider list figure.

Here’s a quick video from my bot, showing how steering the optimal line in a distance-based event makes those two distance figures diverge:

Notice how the two figures start off matching, but by the end are around 200 meters apart.

Notice also how the two figures remain different until I leave the event cooldown. When that happens, Zwift changes the center HUD to use wheel rotation distance, matching the rider list distance. (We could call this “free ride mode”, as wheel rotation distance is what is used in free rides on both the center HUD and rider list.)

So that’s our first and second questions answered. On to the third and final…

Distance Tracking In Time-Based Events

The vast majority of Zwift races are what I would call “distance-based” events. That is to say, they’re based on covering a particular course distance, often one or more laps of a given route. In a distance-based event, steering the optimal line is advantageous, as it reduces how much road you actually have to cover, allowing you to complete a course more quickly.

But what about time-based events? I’ve been thinking about this lately due to Zwift Insider’s VO2sday Micro Races, which are 4-minute events. You race 5 of them back to back, and the winner is the rider who covers the most distance.

But how is distance measured in time-based events? Is it based on who gets furthest down the road, or who gets the most wheel rotations? I did some tests to find out.

First, I have two videos from 5-minute events with the same solo rider on the same bike holding the same power in both. The only difference is that in the first video, I steer the bot onto the optimal line. In the second video, the bot isn’t steered.

Steering the Optimal Line in a Time-Based Event

No Steering in a Time-Based Event

The activity details pages for these events show the actual event distance saved by Zwift, to two decimal places (much more precise than the single-digit display on the results screen that pops up when the event ends). Zwift says the bot steering the optimal line in the first video covered 3.16km (see results), while the non-steering bot only covered 3.05km (see results).

That all seems sensible. The bot steering the optimal line makes it further down the road than the non-steering bot.

But notice this: the HUD shows both bots traveling the same distance in the 5-minute event! In both videos, the distance ticks over to 3.2km right after time runs out.

Clearly, Zwift is showing centerline distance in the results pop-up. But they’re showing wheel rotation distance in both HUD locations during the actual event!

To confirm this, I ran two more tests, this time on Tempus Fugit. In the first test, I steered the bot badly, veering back and forth across the road. In the second test, I didn’t steer the bot at all:

Steering Badly in a Time-Based Event

No Steering in a Time-Based Event

Zwift’s results show the badly-steering bot covered 3.09km (see results), while the non-steering bot covered 3.14km (see results). This is exactly what we would expect if Zwift is using centerline distance for their results. The non-steering bot makes it further down the road than the badly-steering bot.

Notice again, though, that the HUD shows the same distance for both bots during the event! (It ticks over to 3.3km just before they hit the 5-minute mark.)

Answers Lead To Questions

Once I discovered that the distance shown during a time-based event differs from the distance shown in Zwift’s results, I began to wonder: what distance figure are we using for our VO2sday results hosted at LeadoutEsports.com?

This is important because if our results are using wheel rotation distance, then steering doesn’t matter in time-based events! You could veer back and forth across a straight road, finishing behind another rider, but actually come out ahead because you covered more distance… more wheel rotations.

But if our results use centerline distance, then steering does matter, because it lets you get further down the road than the other rider, all other things being equal.

So I set up a test event and worked with Alejandro over at Leadout Esports to track live data from Zwift’s API. That experiment told us two things:

  • Zwift is sending centerline distance (not wheel rotation distance) via their API.
  • Zwift has shadowbanned my bots, probably after detecting them holding steady power for too long. (Did you know Zwift has an automated system that shadowbans riders who break certain rules? More on this in another article, someday…)

So the actual distance we’re using to rank riders for VO2sday is different from the distance they see in their HUD while racing. While riders see wheel rotation distance during the race, the finishing screen popup shows centerline distance (to only 1 decimal place), and the actual data from Zwift’s API also uses centerline distance.

So yes: steering the optimal line does give you an advantage in VO2sday events. Just like in distance-based events.

Your Thoughts

I’ll admit, I probably went too far down the rabbit hole on this one. But I figured if I did the digging, I might as well share the results, in case others have the same question.

Share your thoughts or questions below…


Notable Zwift Events for the Weekend of August 29-30

0

Do you want to be pushed to the limit, or ride at a social pace? This weekend we’re featuring three different races, sandwiched between two beginner-friendly social banded rides. You do you!

A group of cyclists in green jerseys rides across a wooden bridge above a river with sailboats. “Wobble Cycle Club” logo with a vintage bicycle appears in the upper left corner.

✅ Banded Ride  ✅ Beginner-Friendly  ✅ Birthday

Beth’s Badge Hunt is a series of monthly rides taking on big Zwift routes, and this month’s ride is a celebration of ride leader Beth Phillips’ birthday! These are banded rides, so everyone can ride at whatever effort level they’d like.

This weekend’s ride is on Yorkshire Double Loop (29.7km, 547m).

Saturday, August 29 @ 7:15am UTC/4:15am ET/1:15am PT
Sign up at zwift.com/events/view/5680739

✅ Popular ✅ Custom Finish

ZABI‘s popular race is on Richmond’s classic 2015 Worlds route this week, with a custom finish line at 29.3km. That means you’ll complete one full lap, followed by most of a second lap, but ending (it appears) atop Libby Hill!

It’s a mass-start race, with results divided up into categories.

Sunday, August 30 @ 8:35am UTC/4:35am ET/1:35am PT
Sign up at zwift.com/events/view/5682714

✅ Popular  ✅ Stage Race

This weekend SISU’s popular Vuelta-Inspired Punainen race series is in Watopia on the Three Little Sisters route (38.4km, 437m) for its third stage. These are the most popular races this weekend, so if you’re looking to compete with lots of riders, look no further.

Learn more about the SISU Punainen series >

Multiple time slots Saturday and Sunday
Sign up at zwift.com/events/tag/sisu

✅ Climbing ✅ Popular ✅ Stage Race

The other popular stage race currently underway is the 13-stage Tour de Hisp 2026. Saturday is stage 6, and it’s a climby one on Innsbruck’s Achterbahn (47.7km, 988m elevation).

Learn all about Tour de Hisp 2026 >

Even if you haven’t been racing all the stages, you can sign up and go all-in on a single stage for a great race workout. Six different start times to suit your schedule!

Multiple time slots Saturday
Sign up at zwift.com/events/tag/hisp

✅ Beginner-Friendly  ✅ Banded  ✅ 60+

This fairly new group ride caters to the 60+ crowd, but anyone under 60 is welcome, too! It’s banded, so you can go as hard or as easy as you want, and everyone will stay together.

This week’s ride is on Makuri Islands’ Chasing the Sun (35.1km, 315m).

Saturday, August 29 @ 2pm UTC/10am ET/7am PT
Sign up at zwift.com/events/view/5682021

How We Make Our Picks

We choose each weekend’s Notable Events based on a variety of factors including:

  • Is the event unique/innovative in some way?
  • Are celebrities (pro riders, etc) attending/leading?
  • Are signup counts already high, meaning the event is extra-popular?
  • Does the ride include desirable unlocks or prizes?
  • Does the event appeal to ladies on Zwift? (We like to support this under-represented group!)
  • Is it for a good cause?
  • Is it just plain crazy (extra long races, world record attempts, etc)?
  • Is it a long-running, popular weekly event with a dedicated leader who deserves a shout out?

In the end, we want to call attention to events that are extra-special and therefore extra-appealing to Zwifters. If you think your event qualifies, comment below with a link/details and we may just include it in an upcoming post!
Just How Fit Are Other Cyclists For Your Age? (GCN Video)

Just How Fit Are Other Cyclists For Your Age? (GCN Video)

This week, GCN partnered with Zwift to produce a video analyzing millions of power data points from Zwift users gathered over the past 12 months. The data, when combined with users’ weight, age, and gender, helps answer a few common questions cyclists ask, especially:

  • How fit am I compared to the universe of cyclists?
  • How does my fitness change with age?

Here’s the full video… a quick and worthy watch before we dig into the numbers below:

Finding Your Data

To compare yourself to the stats presented in the video, you will, of course, need to know your numbers! These can be found just about anywhere you send your cycling data, including Zwift and Strava:

  • Zwift shows your Power Profile Over Time (a new feature!) at zwift.com/feed (click MY PROFILE, then POWER)
  • Strava subscribers can see their Best Efforts Power Curve under Training>Power Curve (strava.com/athlete/analysis)

It’s worth noting that Dan mentions a very valid caveat to the accuracy of the data presented in the video. The data is pulled from Zwifters’ activities over the past 12 months, but we don’t know how many of those riders have actually completed max efforts at the four durations below. It’s likely that the actual max-effort numbers for the Zwift population are a bit higher than what you see below.

With that said, here’s the Zwift data presented in the video, so you don’t have to hit pause while calculating your values…

5-Second Power

Male

Age GroupBottom 10%Average RiderTop 10%
20-294.16 W/kg8.75 W/kg14.06 W/kg
30-393.94 W/kg8.21 W/kg13.00 W/kg
40-493.91 W/kg7.96 W/kg12.42 W/kg
50-593.74 W/kg7.36 W/kg11.32 W/kg
60-693.44 W/kg6.56 W/kg9.99 W/kg
70-792.85 W/kg5.52 W/kg8.41 W/kg

Female

Age GroupBottom 10%Average RiderTop 10%
20-293.41 W/kg6.53 W/kg10.42 W/kg
30-393.12 W/kg6.01 W/kg9.49 W/kg
40-493.09 W/kg6.00 W/kg9.30 W/kg
50-592.95 W/kg5.60 W/kg8.50 W/kg
60-692.73 W/kg5.12 W/kg7.57 W/kg
70-792.37 W/kg4.36 W/kg6.47 W/kg

1-Minute Power

Male

Age GroupBottom 10%Average RiderTop 10%
20-292.88 W/kg4.75 W/kg6.82 W/kg
30-392.74 W/kg4.52 W/kg6.47 W/kg
40-492.68 W/kg4.37 W/kg6.21 W/kg
50-592.54 W/kg4.05 W/kg5.70 W/kg
60-692.34 W/kg3.67 W/kg5.09 W/kg
70-791.97 W/kg3.18 W/kg4.44 W/kg

Female

Age GroupBottom 10%Average RiderTop 10%
20-292.42 W/kg3.86 W/kg5.45 W/kg
30-392.24 W/kg3.63 W/kg5.13 W/kg
40-492.20 W/kg3.58 W/kg5.02 W/kg
50-592.08 W/kg3.36 W/kg4.71 W/kg
60-691.92 W/kg3.09 W/kg4.29 W/kg
70-791.67 W/kg2.71 W/kg3.84 W/kg

5-Minute Power

Male

Age GroupBottom 10%Average RiderTop 10%
20-292.27 W/kg3.63 W/kg5.10 W/kg
30-392.15 W/kg3.41 W/kg4.73 W/kg
40-492.10 W/kg3.28 W/kg4.51 W/kg
50-591.99 W/kg3.05 W/kg4.16 W/kg
60-691.82 W/kg2.78 W/kg3.76 W/kg
70-791.54 W/kg2.43 W/kg3.34 W/kg

Female

Age GroupBottom 10%Average RiderTop 10%
20-291.95 W/kg3.07 W/kg4.28 W/kg
30-391.81 W/kg2.88 W/kg4.02 W/kg
40-491.77 W/kg2.82 W/kg3.89 W/kg
50-591.69 W/kg2.65 W/kg3.65 W/kg
60-691.56 W/kg2.45 W/kg3.36 W/kg
70-791.36 W/kg2.15 W/kg2.89 W/kg

20-Minute Power

Male

Age GroupBottom 10%Average RiderTop 10%
20-291.95 W/kg3.09 W/kg4.32 W/kg
30-391.86 W/kg2.93 W/kg4.05 W/kg
40-491.83 W/kg2.84 W/kg3.89 W/kg
50-591.73 W/kg2.67 W/kg3.63 W/kg
60-691.61 W/kg2.45 W/kg3.32 W/kg
70-791.36 W/kg2.16 W/kg2.97 W/kg

Female

Age GroupBottom 10%Average RiderTop 10%
20-291.69 W/kg2.65 W/kg3.70 W/kg
30-391.57 W/kg2.51 W/kg3.50 W/kg
40-491.55 W/kg2.47 W/kg3.42 W/kg
50-591.48 W/kg2.34 W/kg3.22 W/kg
60-691.38 W/kg2.18 W/kg3.00 W/kg
70-791.19 W/kg1.92 W/kg2.69 W/kg

Additional Metrics

The video above also shares some simple graphs showing additional data:

  • How much our power output changes with age
  • How much our weight changes with age

As I said… well worth a watch.

Your Thoughts

So how do you measure up? I managed to make the top 10% for my age group (40-49) in 1-minute and 5-minute power, but fell just short in 5-second power and well short in 20-minute power. (Interestingly, this is quite a different result from when I compared my data using ZwiftPower’s rider phenotypes charts back in 2020. Either I’ve changed, the population data has changed, or both. Or maybe it’s time for a 20-minute power test?)

Share your results and any other thoughts and questions below!


A Club Ladder Tourney: What Can You Do With 200 5v5 Teams?

4

A Club Ladder Tourney: What Can You Do With 200 5v5 Teams?

Club Ladder, also known as “5v5”,  has now been running for more than three years, with more than 16,000 races contested by 7,500+ unique riders. By sheer volume, it may be the largest community team racing series on Zwift, but its scale isn’t really what makes it interesting.

The unique thing about Ladder is how much control it gives the teams themselves. Two captains agree to race, they find a time that works for both teams, and they get on Zwift and race. There is no fixed weekly schedule, no central race organizer deciding who races whom, and no requirement that every team participates every week. Teams can take it as seriously as they like, build rivalries, race with the same group of mates every week, or simply jump into whatever challenge looks interesting.

In that sense, it is perhaps the most team-empowering series on Zwift.

Over the years we’ve added a few things around that core format to give teams extra motivation:

  • Rungs give teams a smaller group of nearby opponents to compete against
  • Belts allow teams to challenge for some extra bragging rights
  • We’ve also experimented with different race formats, including 5v5v5 racing and Points Races

But we’d never really tried taking the teams and flexibility that make Club Ladder unique and building something completely different around them.

In 2026, we decided to try a tournament.

The Road to a Tournament

This wasn’t our first attempt at doing something different. As mentioned above, in late 2023, Club Ladder introduced one-off 5v5v5 races, and in 2025 we introduced Points Races, adding segment scoring to the standard Ladder format.

For 2026, we wanted to go a little further and create a completely separate competition using the teams and infrastructure we already had.

The opportunity was sitting right in front of us. More than 200 teams were already configured on the Ladder site, captains were actively engaged on Discord, and thousands of riders were already familiar with the format. We didn’t need to create a new racing community from scratch. We just needed to ask whether those teams wanted to try something different.

The answer wasn’t universal. Some teams weren’t able to participate, while others were perfectly happy carrying on with normal Ladder racing. That was fine. The tournament was designed as an additional competition, not a replacement for the format that had already brought thousands of riders to Ladder.

For those who did want to participate, we still had to figure out exactly what they were signing up for.

Designing a Tournament With 200 Cycling Teams

We considered plenty of possibilities, from an FA Cup-style knockout to smaller rung championships, mass-start races, relays, and large multi-team races.

The challenge was finding something that worked with Ladder’s greatest strength: flexibility.

A traditional knockout tournament doesn’t fit that model particularly well. If two teams have to arrange a race themselves, a single round can easily take a week or more. Multiply that across several rounds and the tournament could stretch for months.

There was also the rest of the Zwift racing calendar to consider. Ladder’s flexibility has always allowed it to coexist with ZRL, DRS and the many other competitions taking place throughout the year. A tournament with fixed dates and times would remove some of that flexibility, so we wanted to keep the experiment contained.

We settled on three weeks. We needed a format that could take all the participating teams down to a clear champion(s) in only three races, with everyone racing on the same night.

The 2026 Ladder Tournament

Rather than trying to crown one global champion from 200+ teams, we used the existing Rungs to create groups of roughly 10 teams and let each group race down to a champion.

Diagram of a bike race tournament: 10 teams compete in Round 1, 4 advance to Round 2, 2 reach Round 3, and 1 champion wins. Arrows show progression through each round.

Rounds 1 and 2 would be mass-start races, with as many as ten teams competing together. But we didn’t want to simply run a normal mass-start race and add up finishing positions. One of the things people love about Club Ladder is its tactical, team-oriented nature, so we wanted the scoring to reward teams for working together.

A New Concept: Team Cohesion Bonuses

The basic idea was that the team’s score would start with the finish time of its third rider. You need at least three riders to finish, and that third rider establishes the team’s base time.

From there, teams could reduce their time by demonstrating cohesion by keeping the riders around that third rider close together.

In Round 1, if the first rider finished within five seconds of the third, the team received a 20-second bonus. A gap of less than ten seconds earned ten seconds, and less than 20 seconds earned five seconds.

The same scale applied between the third and fifth riders, provided the team had five finishers.

So a team with five riders finishing within five seconds of each other could take as much as 40 seconds off its third rider’s time.

Third rider’s time − cohesion bonuses = team time

Lowest time wins.

For example, if a team’s third rider finished at 30:08 and both the first and fifth riders were within five seconds, the team would receive two 20-second bonuses and finish with a score of 29:28:

Ten cyclists race in Round 1; four advance to Round 2. Two advance to Round 3, and one champion is crowned, shown by a trophy icon.

The deliberately large bonuses were intended to create strategic decisions. If your fifth rider was dropped, was it worth slowing down to bring them back and recover the 20-second bonus? We wanted the answer to be “often, yes.”

The format is somewhat similar to Team Time Trials in ZRL and Team Time Races in the Dirt Racing Series, but with an important difference: this was still a mass-start race, and we were explicitly rewarding team cohesion.

Round 1: A Live Experiment

Teams figured out the basic strategy surprisingly quickly. Getting across the line together was important, but preventing other teams from doing the same was arguably just as important.

Round 1 featured Triple Twist, with decisive climbs over Jarvis and the Hilly KOM. Most races became tactical affairs, with teams saving their powder for attacks on the climbs. Teams that lost their fifth rider were almost immediately in trouble because they could no longer earn the second cohesion bonus, and most of the teams that kept five riders together eventually came down to a bunch sprint.

There were some genuine heroics, though. Several teams used their team time trial skills to regroup after riders were dropped, with their strongest riders sometimes sacrificing their own finishing position to keep the team together.

Team TFC provided perhaps the best example. After the KOM, the team regrouped around riders who had been dropped and deliberately stayed together rather than chasing individual finishing positions. Under this scoring system, that was exactly the right decision.

A bike race bracket: Round 1 has 10 teams, top 4 advance; Round 2 has 4 teams, top 2 advance; Round 3 has 2 teams, 1 champion winner with a trophy icon.

Round 1 also exposed a flaw in the scoring. Because the back-end cohesion bonus depended entirely on the fifth rider, once Rider 5 was dropped, Rider 4 effectively stopped mattering to the team’s score. Some fourth-place riders ended up soft-pedaling or even DNFing, which was the opposite of what we wanted.

The goal was for all five riders to have a reason to stay together, so we changed the scoring for Round 2.

Round 2: Tighter Scoring

For Round 2, Riders 4 and 5 could each earn their own cohesion bonus based on their gap to Rider 3:

Gap from Rider 3Rider 4 bonusRider 5 bonus
Less than 5 seconds10 seconds10 seconds
Less than 10 seconds5 seconds5 seconds
Less than 20 seconds2 seconds2 seconds

The bonuses were smaller, but keeping the fourth rider close still mattered even if the fifth rider had already been dropped.

We also changed the course topography, with Round 2 finishing uphill on the Rooftop KOM on Makuri’s Electric Break. The climb punished teams that had saved everything for a final sprint, while the tight final corner produced several very close finishes. Several teams missed out on cohesion bonuses by mere tenths of a second.

In the end, only two teams remained in each group.

The finals were set.

Round 3: 5v5 Finals

For the finals, we went back to what Club Ladder does best: a traditional 5v5 race.

This time we abandoned the experimental time-bonus scoring and returned to finish-position points. The course was The Muckle Yin, offering two climbs of more than two minutes, sprint climbs, rollers and a flat sprint finish.

After some heroic catches, tactical attacks and close finishes, the points were tallied and our first Ladder Tournament champions were crowned:

  • Americas: Coalition Akkadium, TFC X-Force, OTR RED_PELOTON, SISU Meno
  • APAC: 4STAR Apollo
  • EMEA: Cryo-Gen Handlebar Heroes, Foudre Picodon, TeamNL VacMasters, SZR Delta Force, KLUB Smarties, Dunking Teabags, SZR G-force, SZ Loki, DIRTy Pyrites, WCC The Spinning Discs, Fellowship Shadowstep
  • Women’s: LEVEL Krakens, Coalition Galaxium

Huge congratulations to all of the winning teams, who now have the coveted virtual trophy on their team page and the rarified Club Ladder Kit in their garage to wear for the balance of the year.

What Did We Learn?

The tournament is now over, but the experiment isn’t really finished.

We sent a feedback survey to participants to find out what worked, what didn’t, and whether they would do it again. We received 130 responses from a mix of riders and captains.

The headline numbers were encouraging:

  • 83% said they would personally race in a future tournament, with another 15% saying maybe.
  • 69% said the different scoring format made the tournament more interesting.
  • 62% wanted to see one or two tournaments per year, while another 35% would happily race three or more.

The comments also highlighted three themes.

Theme 1: The Tournament Was a Welcome Change of Pace

The clearest message from the feedback was that people liked the idea of a tournament. Several riders described it as a great way to shake things up, while others offered ideas for how future editions could build on it.

One recurring criticism was that the tournament ended too quickly for teams eliminated in Round 1. A double-elimination or “loser’s bracket” format could give those teams something to keep fighting for, even after missing out on the main prize.

Theme 2: Scoring Was Interesting, But Difficult to Follow In-Race

The feedback on the scoring was generally positive. Sixty-nine percent of respondents said that having a different scoring system from regular 5v5 made the tournament more interesting, and 73 of the 130 respondents rated the scoring as easy or very easy to understand.

The bigger challenge was understanding what the scoring meant during the race. Because the result depended on the third rider’s time and the gaps to the other riders, it wasn’t always obvious which teams were currently ahead or whether a few seconds of separation had gained or lost a valuable cohesion bonus. Several riders suggested that better in-game or third-party tools showing the live team score would make the format much easier to race.

There was also some debate about the racing the scoring encouraged. Some teams enjoyed the emphasis on keeping five riders together, while others felt the large cohesion bonuses could discourage attacks and lead to races being decided by a final sprint. Several riders suggested keeping the team-cohesion element but adding additional ways to score during the race, such as intermediate sprints or KOMs.

We seem to have succeeded in making team cohesion an important part of the race. The next challenge is finding ways to add more tactical opportunities without losing that team element.

Theme 3: A Tournament Can’t (And Shouldn’t) Replace Ladder

One of the things that makes Club Ladder work so well is that teams have a surprising amount of control over their experience. In a normal Ladder race, captains can look at the teams around them, find an opponent that makes sense, and issue a challenge. If the team at the maximum challenge range (up to seven spots above you) is stacked with top-level riders and your squad availability is limited that day, you can save that challenge for another week when you’re able to put out your best team. The flexibility is built into the format.

The tournament necessarily changed that. Once the groups were drawn, teams couldn’t choose their opponents or race times, and a few respondents pointed out that some matchups were very uneven as a result, particularly in the smaller Americas and APAC time zones. Balancing competitive matchups with having enough teams in each race to make the tournament viable is a real challenge when numbers are low.

This reinforced something important for us: the tournament isn’t intended to replace regular Ladder racing. Some teams wanted to compete for a tournament championship, while others either couldn’t participate or simply preferred the normal Ladder format. Both are perfectly valid. The tournament gives teams another way to use the Ladder community and infrastructure, while the regular week-to-week Ladder competition remains the flexible, team-driven format that has worked for thousands of riders.

What Would We Change?

There were some lessons from the organizer side, too. We’d improve the time zone support and communication up front, and we’d pressure-test the rules more thoroughly with practice races before experimenting in a live tournament.

We also didn’t account for adding the races to ZwiftPower, which turned out to be something people really did want. That required quite a bit of manual effort to get right.

But overall, we’re pleased with the results. The vast majority of respondents said they would do it again, and that’s probably the best test of a community racing experiment.

So, How Would You Do It?

Club Ladder gives us a pretty unique opportunity. We have more than 200 teams, an established community, active captains, and thousands of riders who already know how to race together.

We tried one way of turning that into a tournament in 2026. It worked well enough that we’d like to do it again, but there are plenty of ways we could make the next one better.

Would you run a knockout? A round-robin? Mass-start races? Relays? Keep the Rung structure, or throw it away completely?

How would you balance the teams, keep the racing competitive, and still preserve the flexibility that makes Club Ladder unique?

Give us some suggestions in the comments below!


Tiny Race Series – August 29 Routes – Downhill Finishes

0

Tiny Race Series – August 29 Routes – Downhill Finishes

See zwiftinsider.com/tiny for current Tiny Race details.