Editor (Eric’s) note: Monica wrote the original version of this post over 3 years ago, and since then has become quite a cyclist herself, completing the challenge of riding all Zwift routes (among other things). With many couples stuck at home these days and looking for ways to stay active, we thought this would be a great post to re-share. Enjoy!
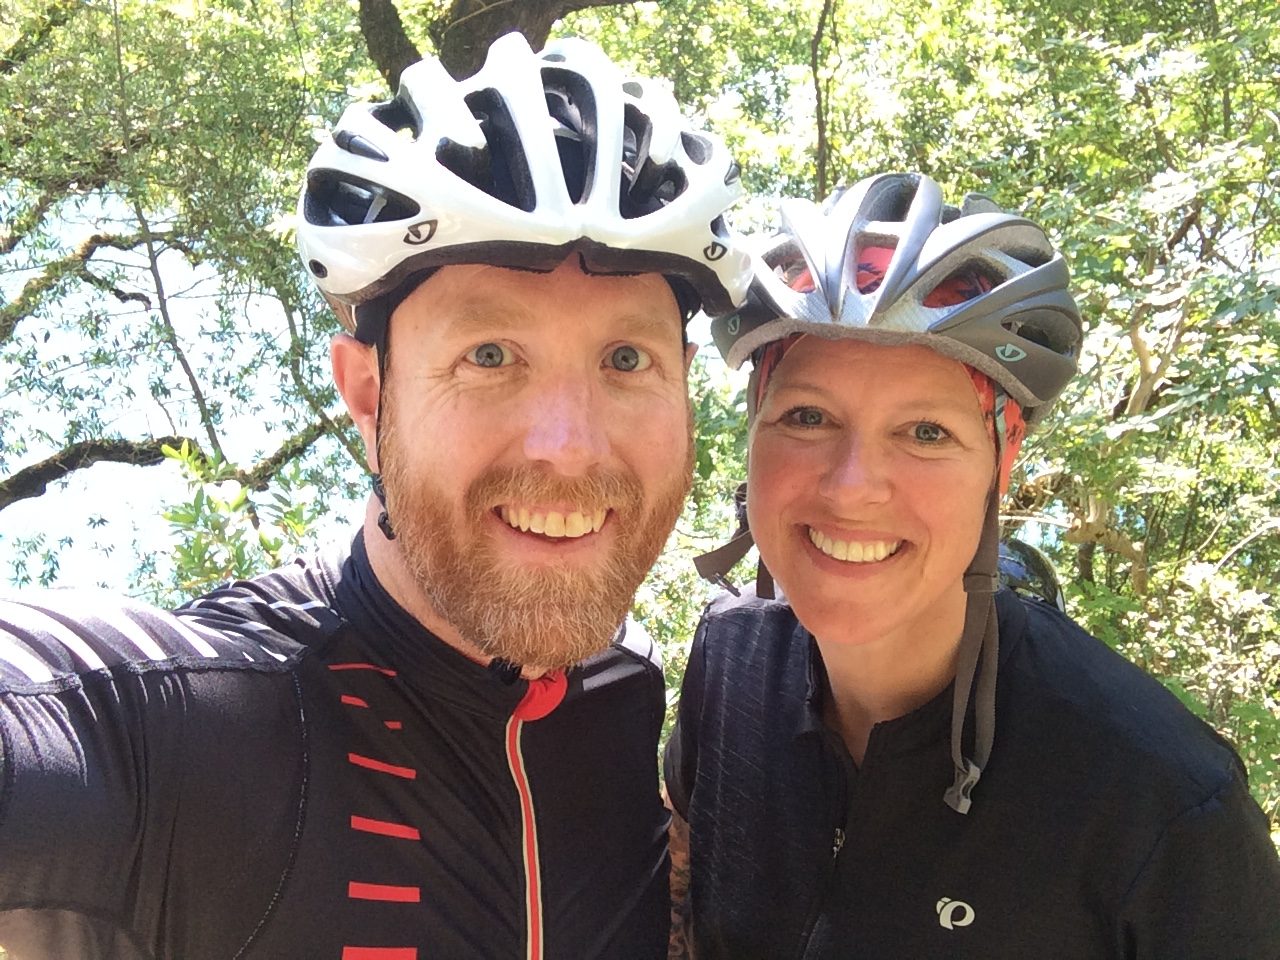
As the non-athletic spouse of a very devoted and disciplined cyclist, I’ve become the recipient of encouragement to also become a cyclist. I don’t use the term “encouragement” jokingly. My husband has truly been a champion when it comes to turning me into a regular spinner of the wheels. It’s probably been a tough battle for the poor guy, having to balance his desire to see me ride with not turning into an annoying nag, even when I’m being a baby-whiney-pants about it. He’s been awfully patient with me through it all and although I’ve not become as passionate as he, I do call myself a cyclist and enjoy a good ride fairly regularly.
If you have someone you’re trying to encourage to become a cyclist you may find these tips, taken from what Eric did for me, helpful…
#1: Be Patient
Another word for patience is “long-suffering.” Sounds fun, doesn’t it? But if you can ride 50 miles on that little seat, on those little wheels, in those tight clothes, in those weather conditions, you can probably hold your tongue more often when working to get someone on a bike. Dear Eric has long-suffered for two years now!
#2: Make it Easy
It’s near-impossible as a non-cyclist to look at a bike and be excited about riding it, especially when you know you won’t be anywhere near your cycling friends’ abilities. So when they first start, let them wear their baggy clothes over the best bib shorts you can find. And let them use platform pedals instead of clip-ins. And let them drive their truck with the bike in the back to the flattest, least-busy part of town to ride where they are comfortable. Anything that makes it difficult will just be another excuse for them to not ride. Let them start small without feeling the need to correct them.
#3: Help Them Gear Up
When they have the neighbor’s old bike that was headed to the dump and your least favorite riding shorts there won’t be much of a draw to ride. Borrow a bike that fits them, or buy a used one to begin with. Along with that, they need a bike fitting from the LBS and may need to work getting a proper seat dialed in. And for the love of all that is good and kind, get them a good pair of shorts!
#4: Be Excited for Them
When they do ride give them kudos on Strava, tell your other friends about it in front of them, tell them you’re happy, and ask them what they thought. Yes, you rode 50 miles at 5am, averaging 22 mph the same day they rode 6 miles at 10am, averaging 12 mph, but they aren’t you and they have to start somewhere.
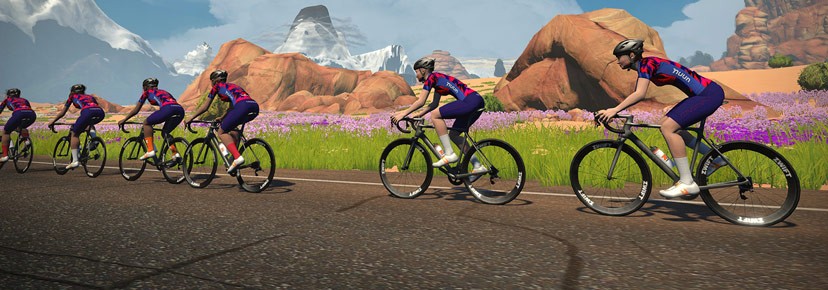
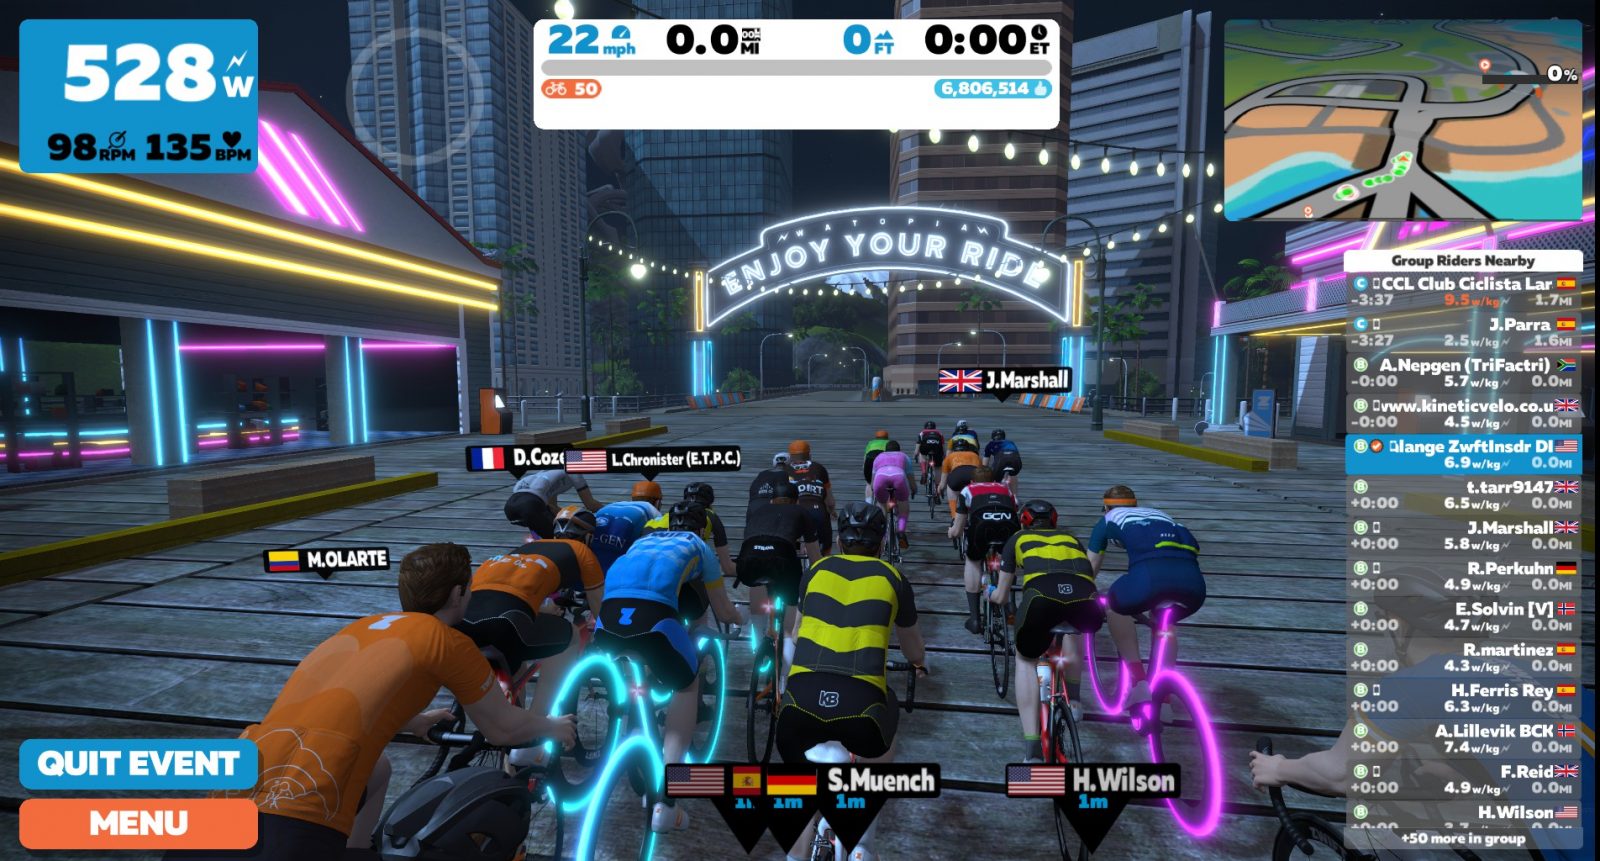
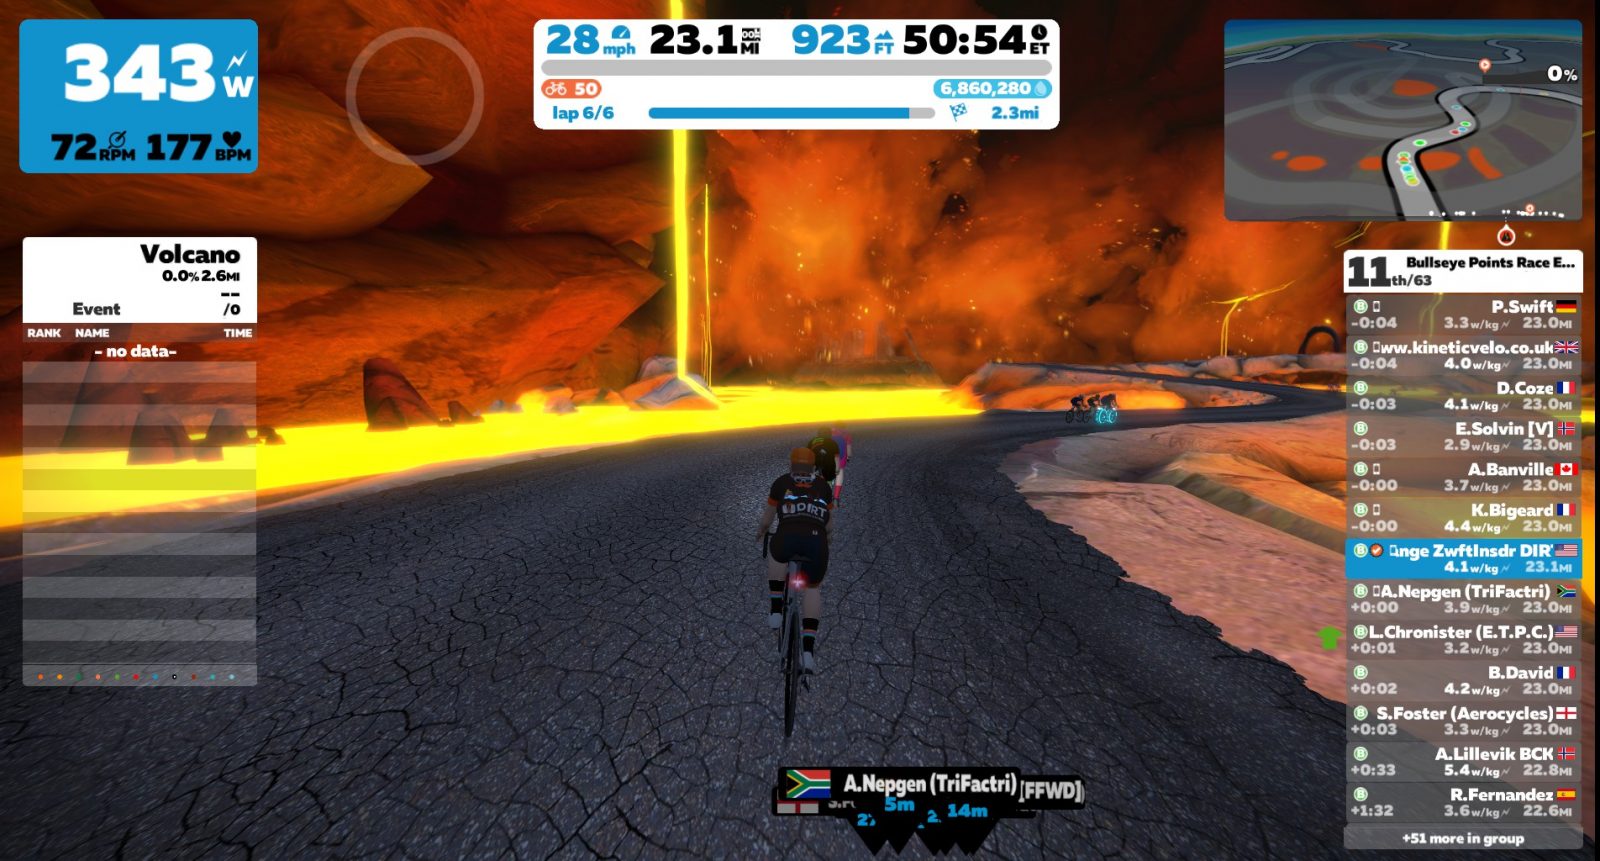
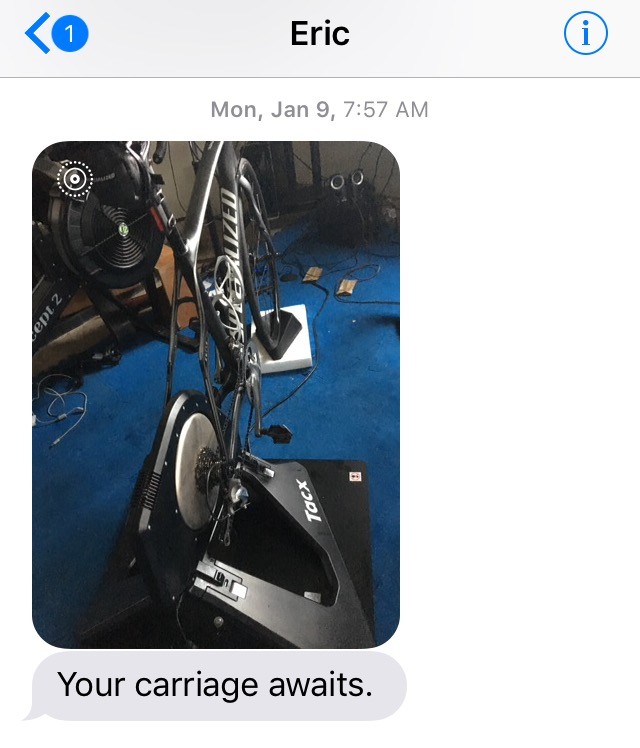
#5: Get Them on Zwift
Don’t just tell them about Zwift, set it up for them. Help them with the trainer, the fan, the connections. Favorite them in Companion so you get an alert when they ride, and can easily give them a Ride On. And ask your friends to give them a Ride On too. Riding on Zwift takes away some of the pressures of cycling (like balance, wind, dogs, and cars) while they gain strength and confidence.
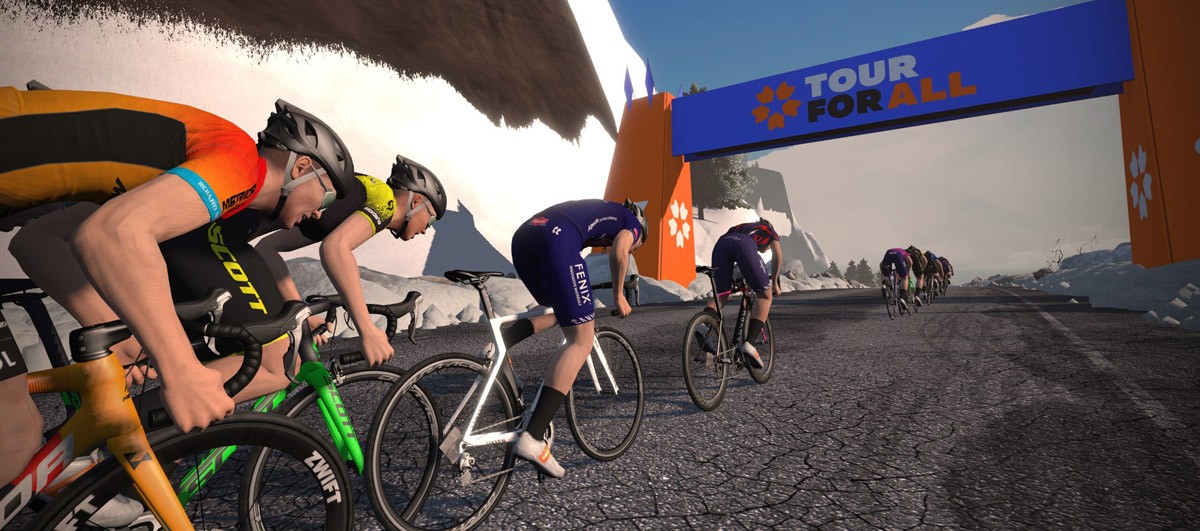
#6: Suggest Group Rides (but don’t expect them)
Group rides can be daunting. To ease them in you can start by riding with them, then eventually invite an extra friend or two along. Invite friends who will be courteous and realize this isn’t the time to take that KOM. Eventually they’ll be more excited about group rides, if they see how forgiving and kind cyclists really are.
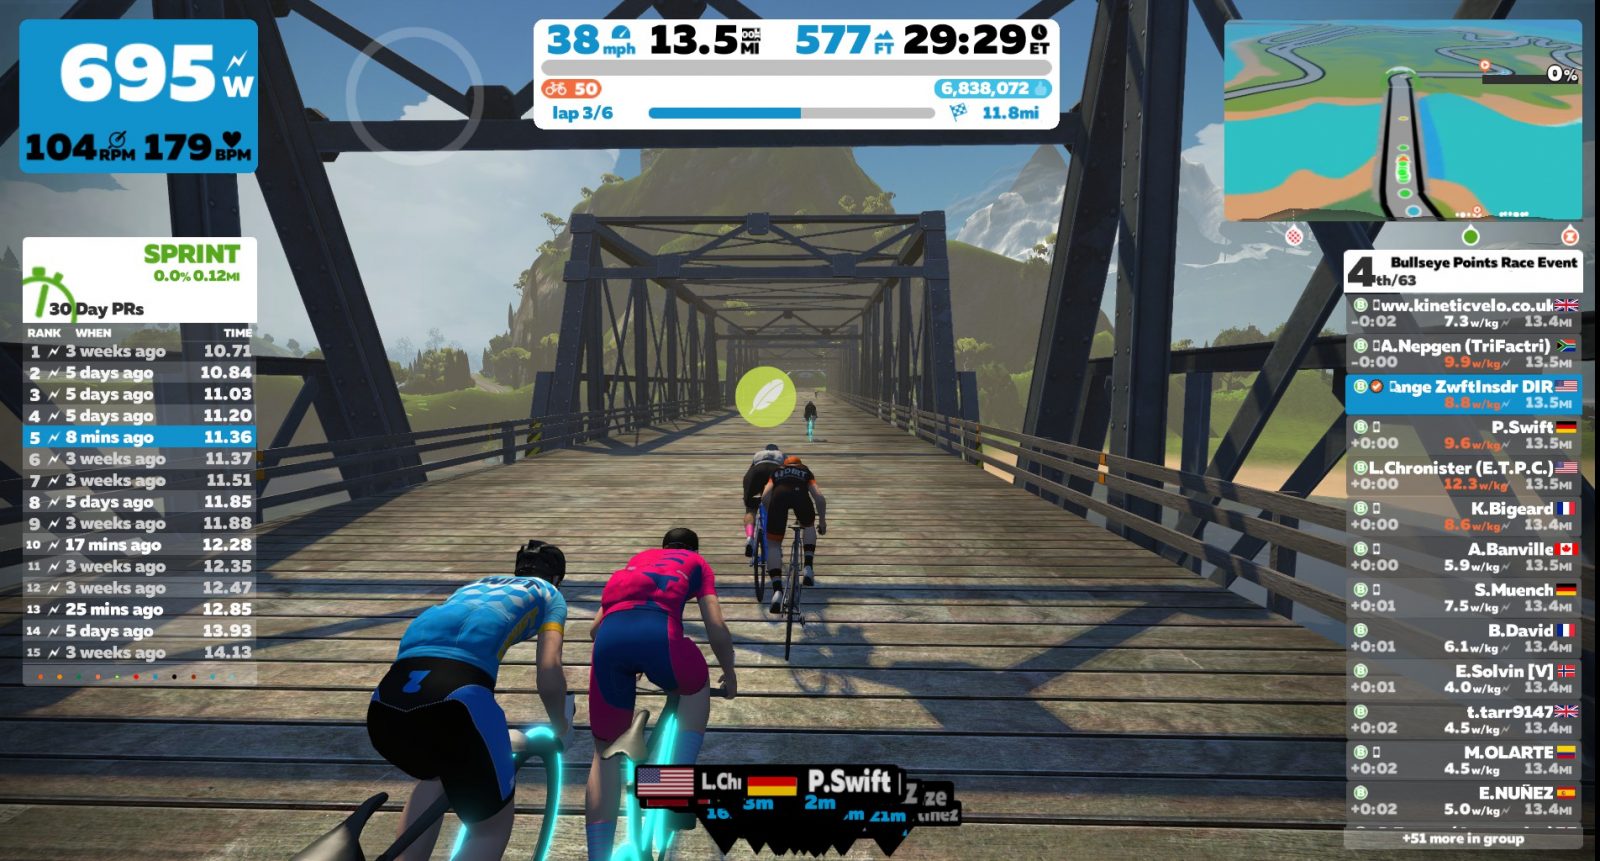
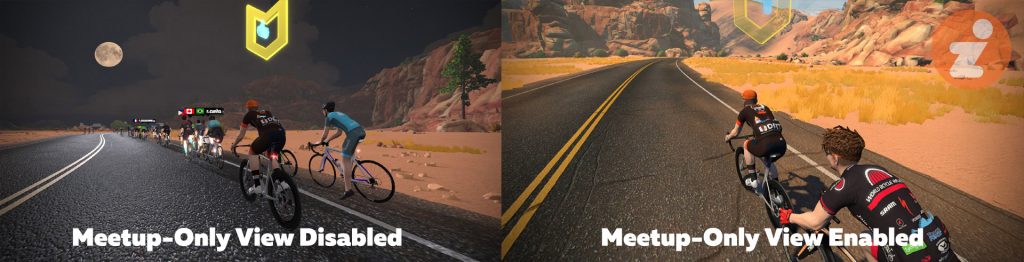
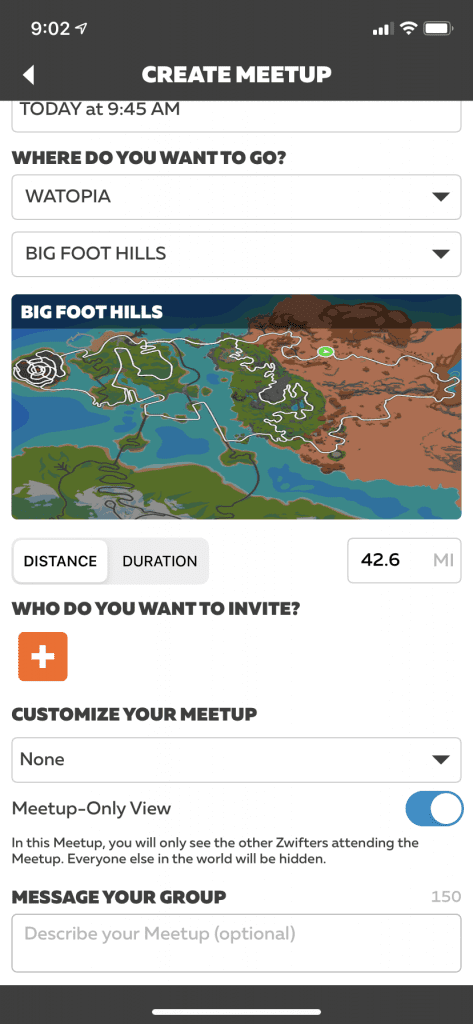
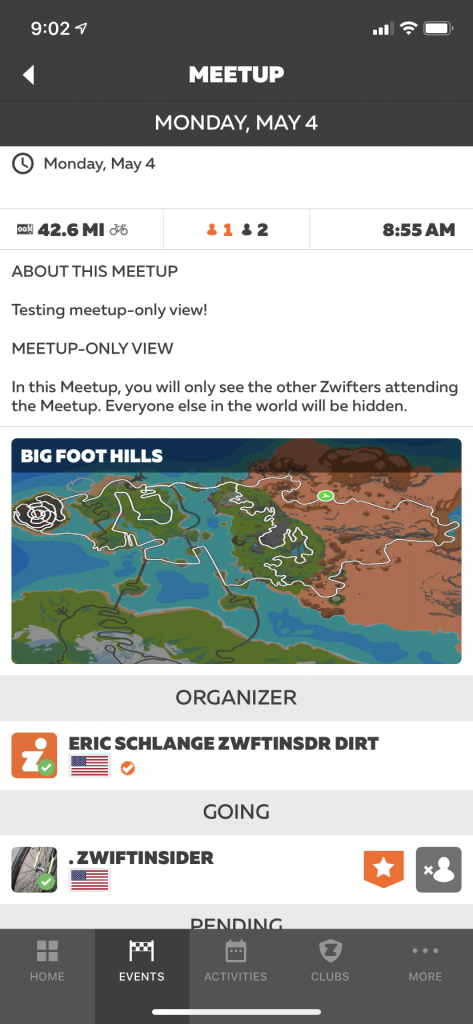
You can also encourage them to do group rides on Zwift where they won’t feel bad if they are much slower than everyone else. Set up a small group Meetup ride on Zwift with people you both know and be sure to ride together at the pace they set.
#7: Help Them with Goals and Rewards
Setting specific cycling goals and being sure of future rewards are both good motivators. Any goal from riding 40 miles in a week to completing a 30-mile ride by the end of summer would be beneficial to them. And if they are on Strava they’ll have a way to easily track those goals.
Join them in meeting those goals, encouraging them along the way. (And consider not telling them what your goals are. If your goal is to ride 6 centuries by the end of the summer they may feel their goal is pathetic.)
#8: Optional – Add Extra Fluff
Once the person you’re trying to coerce into cycling shows real interest, consider adding some extra fluff. If that person is anything like me they need it to be as easy and as comfortable as possible. Get them the very best gloves, the coolest-looking helmet, the most badass jersey, the trainer rocking plate, the sassy socks, the blinking red light, the rearview mirror, the trip to Southern California near their best friend that also happens to have a 50-mile ride going on…
Nagging won’t get your loved one to ride, but lots of long-suffering on your part just might. And babying them. Because who doesn’t like to be babied? You’ve got this!
What About You?
Got some tips we didn’t include? Share them below!


")