In December, two-time Olympian Anthony Famiglietti broke the 4-minute mile on Zwift! The 41-year-old has been training to get back to his best time from a run in 2006: 3 minutes and 55 seconds.
In February 2018, at 40 years old, Famiglietti ran a 3:59 mile with a dog. In November on his 41st birthday, he ran another mile in just under 4 minutes on a treadmill. He submitted that run to Guinness World Records for the fastest mile on a treadmill. (The world record for the fastest mile run overall is 3:43.) But he couldn’t quite match his own personal record of 3:55.
Famiglietti decided to try again on a treadmill at The Running Event 2019, with Zwift on a big screen. He set the treadmill to a 3:58 pace and dropped himself down for a running start. A live audience cheered him on. With less than a minute to go, he upped the pace and his legs flew faster and faster. Did he make it? Watch the video and see.
Anthony Famiglietti: 4-Minute Treadmill Mile (The Running Event 2019)
Tim Reed: Perception vs Reality of Being a Pro Triathlete (Zwift PowerUp Tri Podcast #23)
This week we chat with Australian Pro Tim Reed and the perception vs reality of pro triathletes. Juggling training, family, sponsor obligations, and even a regular job, pro triathletes have more in common with age groupers than you may realize.
We also chat about the recent news of a notable triathlete jumping back into the pro peloton and the recent sponsorship change with the reigning Kona champion. Jordan also discusses some new workout features he personally worked on that just came out for Zwift Run.
About the Podcast:
The Zwift PowerUp Tri Podcast is hosted by former pro triathletes Matt Lieto and Jordan Rapp, lending their in-depth knowledge of the multisport to the Zwift Tri audience.
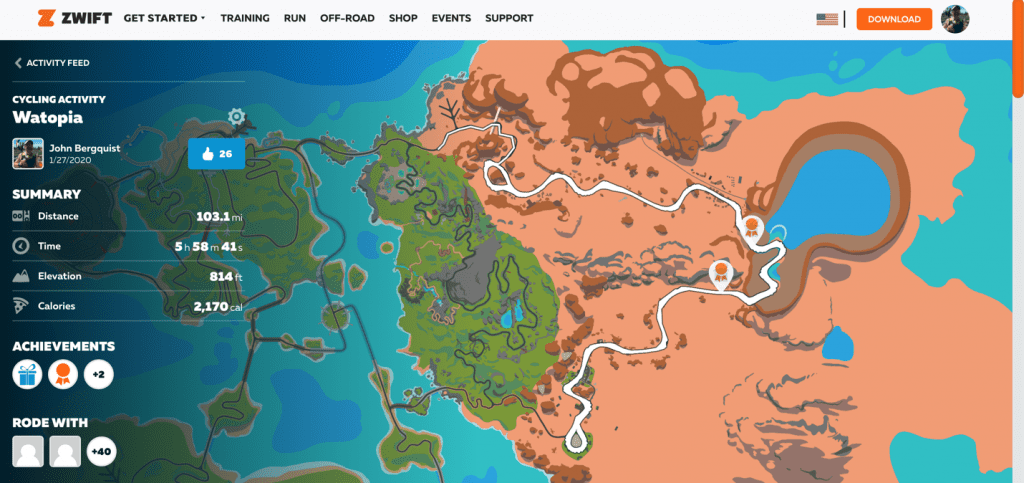
The pinnacle of “success” for most serious cyclists is the century ride: 100 miles on your bike, all in one go. At least this has always been a bucket list item for me, as I’m an age-group triathlete who’s been ramping up his training with goals of completing a 140.6-distance event before he’s 50 (I’m running out of time.)
To that end, I had a goal of completing a century ride by the end of 2019. I even had the weekend picked out, but by the end of October, my training and nutrition fell by the wayside and didn’t put me in a good place to do that. Work and life got in the way, as they will, and the off-season is a hard time to train that hard. So I picked a new hard date of Monday, January 27th. I scheduled the day off from work, planned nutrition and communication with my wife (and training partner), and got my butt back in the saddle to train properly.
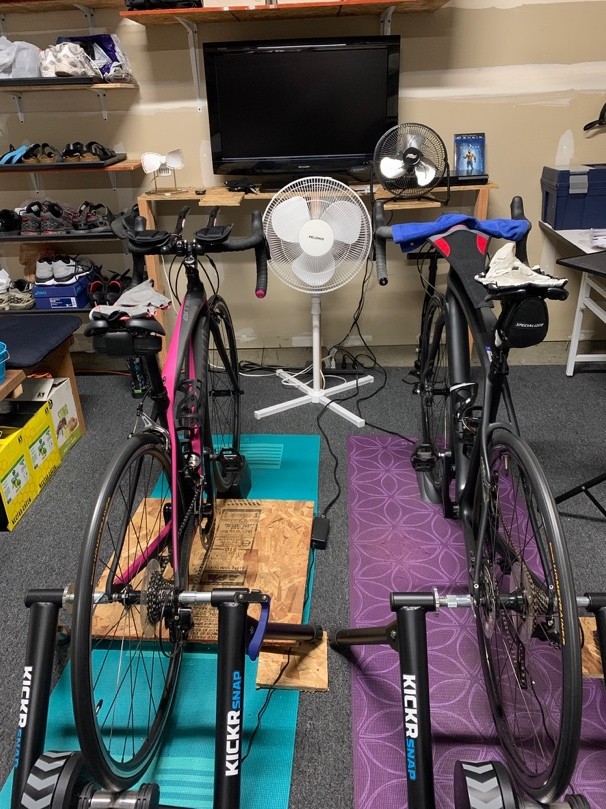
What does this have to do with Zwift? Exactly this: I don’t ride outdoors anymore except on race days. Maybe one ride before the first race of the season to work out the bugs in the system, but otherwise it’s 100% Zwift, my 2016 KICKR Snap (which is still going strong) and our vast DVD library.
The benefits of doing this on Zwift were numerous:
Safety, security, and I didn’t have to worry about weather and stupid drivers
I could take breaks and do a walk around the Pain Cave to stretch out
I could have all the nutrition I wanted right at hand (i.e. my fridge was just inside the garage door)
I could finally earn the coveted metric and imperial century jerseys in Zwift!
That all being said, there are some cons when compared to riding 100 miles outside:
You’re on the trainer; anyone who’s ridden for more than three hours on their trainer knows exactly what this means
Unless you’re watching something really engaging, the time will drag by
You’d better have some bodacious fans, because you’re going to get hot fast
Still, I was excited and couldn’t stop talking about my upcoming “event” to friends and family who usually glaze over within seconds of me starting to talk about triathlon. My wife (a frequent podium-placing duathlete herself) was very encouraging and helped me work out my nutrition plan and how often to take breaks. We agreed that I’d text her every hour when I took a break, so she’d know I hadn’t expired (she would be at work that day).
My bike was cleaned, tires inflated, DVD cases stacked, and I was ready.
The morning of, I got up, had breakfast (oatmeal and a smoothie), and set out my nutrition and hydration. After my wife had left for work, I changed into my kit (my favorite Primal Wear “Ace of Spades” jersey and my most padded bibs), loaded up my first movie (“Man of Steel”), plugged in my Macbook Air, booted Zwift (I chose the “Tempus Fugit” course in Watopia as it was the flattest in the game) and I was off!
The first hour was uneventful, and I was in the zone: 18 miles down. Texted my wife, stretched, and got back to it. Hour two was similar to the first, 38 miles in, had a banana to keep my energy up. Same routine: stretched, used the restroom, texted, jumped back in the saddle. Had to stop to change movies (“Batman vs Superman”, the three-hour-long extended version, was next) and continued on to the third hour (55 miles complete at three hours).
Things were starting to get a little tight, but not bad. Spent most of my time on the hoods. Hit my metric century (and the resulting Zwift jersey) at three and a quarter hours: 62 miles. By the start of the fourth hour (75 miles in) I was starting to get a bit chafed and sore; apparently shifting between the hoods and sitting straight up was causing my chamois to shift in an uncomfortable way. Took the time to take a slightly longer break (three to four minutes), readjust my kit, then got back on. By this time, I’d already gone through one bottle of water, one of electrolytes (SIS hydration tablets), some dried apricots and an SIS energy bar.
My last break was at five hours, 92 miles in. I was really uncomfortable by this time and dreading the last eight miles. Conveniently, my movie ended, and I was able to incorporate my DVD-switch with my break (next up: “Suicide Squad”). My feet hurt, my sit bones were screaming, and my entire kit was soaked through. Did I mention that I had three fans running and it was only 60°F in the Cave?
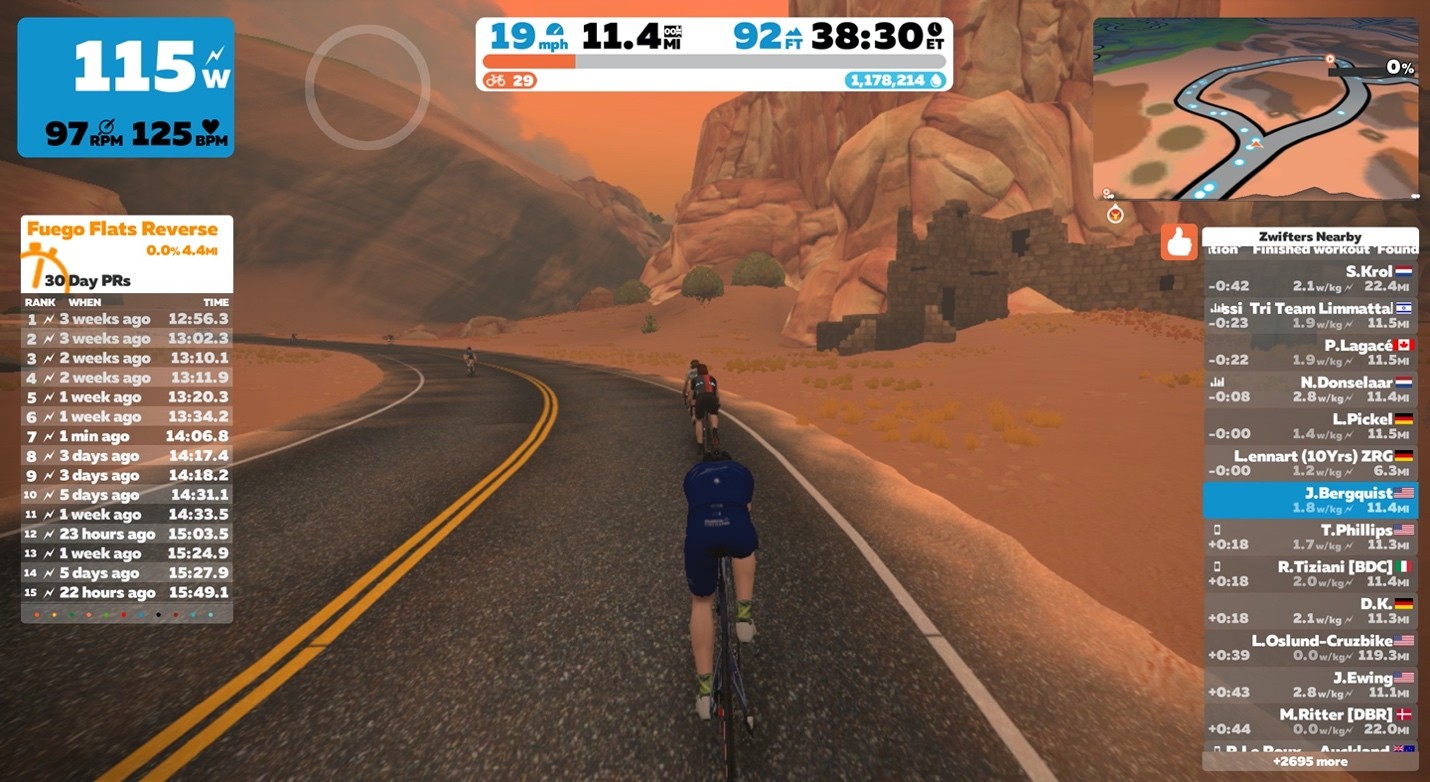
I managed to tough it out and completed the ride in 5:30:22 per Zwift. In my haste, I forgot to take a screenshot before saving the ride, which was very disappointing (the only automatic screenshot that Zwift took was at 11.4 miles):
All in all, this
was a great experience, and one I’ll repeat again as I continue on my road to
Ironman-distance racing. I learned quite a few things along the way:
My longest ride prior was three hours. This was not adequate… I need to be in the four-hour range, or multiple shorter rides in one day.
I need to clean my bike chain, or at least lube it. This is a sanity issue… listening to an even-slightly squeaking chain for five and a half hours will drive you crazy!
My nutrition was perfect. I didn’t bonk out at all, and I felt (mostly) strong the entire time.
A rocker plate would be super helpful for reducing back fatigue (it took two days for my lower back to recover).
So the Zwift Century can be done in the security and safety of your own home. I highly recommend giving it a go if you have the time and inclination; it was a very rewarding experience. I’m already planning my next one!
Thanks for
reading, and please feel free to check my data below:
Zwift has just released statistics from Tour de Zwift 2020 – Zwift’s biggest set of events to date! Here are a few of the numbers:
119,700 took part in the 2020 Tour de Zwift, resulting in 492,652 event completions over 504,951 hours
61,217 Zwifters raced a stage of the Tour de Zwift
15,500 Hours of Live Streamed Content consumed
15.3 million kms ridden (the equivalent of 4,419 people riding the full route of the 2019 Tour de France)
181 million vertical meters climbed
314 million calories burned
77,546 people took part in Stage 1
New Race Component
This year’s TdZ included open races, which is a big change from prior years. Over 61k Zwifters participated in TdZ races, and many of those were new racers, which is always a good thing.
Interestingly, men and women showed an equal appetite for TdZ racing, with 51% of female TdZ participants racing at least once, and 53% of male participants doing the same.
Prior to each stage, a Pro-Am race was held on the upcoming route. These races were live-streamed by Zwift and anchored by OJ Borg and various co-hosts – and they did a fine job. Zwift’s best broadcasts yet! Zwift says over 15,500 hours of content were consumed by viewers watching these Pro-Am races.
Community Support
More than 4.5 million Ride Ons were shared during the Tour de Zwift among participants – a wonderful reflection of the Zwifters supporting one another.
Your Experience
How was this year’s TdZ for you? Did you try any of the races? What was your favorite stage? Share below!
Watopia’s “Seaside Sprint” began as a Rebel Route in August 2019. Zwift made it an official (albeit event-only) route in its February 2020 update.
At only 6.3km (3.9 miles) this is the shortest Watopia loop which includes a sprint segment, making it perfect for races that include sprint points or for group rides with interval efforts like Sprintapalooza. As a route, this is the smallest loop on Watopia apart from Volcano Circuit and Volcano Circuit CCW.
Route Description
This clockwise loop begins at the sprint banner at the end of the Julynn Washington Bridge (JWB) between the Esses and Italian Villas. After passing under the banner you will ride over the cobbles of the Italian Villas, hang a right onto the twisty gravel road, then cross the land bridge to our magmatic friend, the Volcano.
Turn right at the fork after the land bridge, climbing up the short pitch into the volcano, and you will find yourself going through the Volcano Circuit banner. The lap counter just after the banner counts down how many laps you’ve got left.
Ride out of the volcano, turn right onto the glass bridge, then another right into the Esses. The Esses roller coaster will spit you out onto the short reverse sprint over the JWB.
That’s one lap… how many more have you got left?
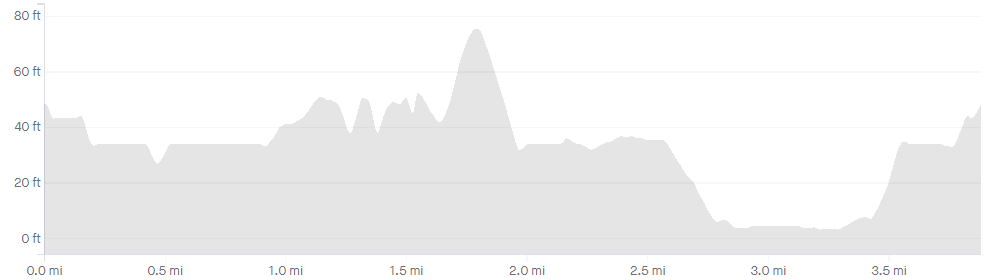
Profile
This route is actually quite flat, except for a few small rollers in the Esses and the short pitch heading into the Volcano.
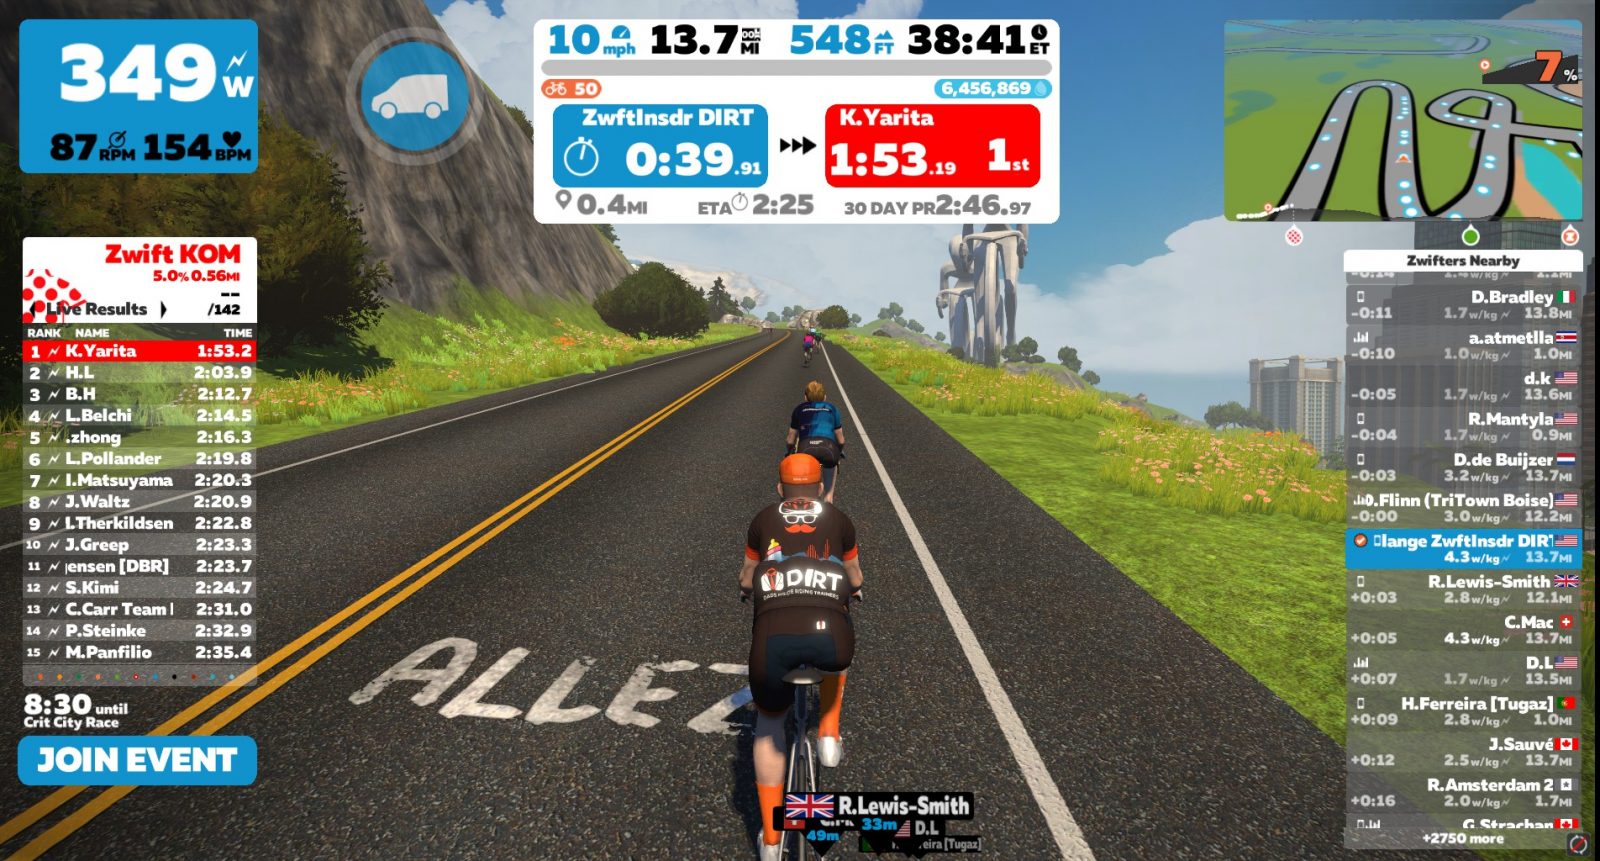
Start Points, Lead-In
Since this is an event-only route, rides will always begin at the downtown Watopia start pier. This gives us a fairly long lead-in of ~3km (1.9 miles). The first lap begins when you hit the sprint banner.
Have you ever laid in bed at night, made big plans for the next morning’s workout… and regretted them as soon as you woke up?
That was me today. Sitting on the edge of my bed at 0-dark-thirty, wondering where I get these terrible ideas.
Because this was my morning plan: to put in a harder ride around 60 minutes long, then follow it with a short Crit City race where I would put in regular attacks while trying to still finish with the front. The pre-race ride would put some fatigue in the legs, then the race attacks would force me to burn matches every few minutes while maintaining a threshold pace in between.
So I was treating today’s race as a workout, training my body to withstand repeated attacks at race pace – something I’ve historically struggled with. I had no plans of winning – I wasn’t even sure if I would be able to stay with the front group. But I knew by the end I would be spent!
I argued with myself for a few minutes in the dark. Then I got up, grabbed my kit, and went upstairs.
Warmup
As mentioned above, my typical 20-minute race warmup was being replaced today by a longer tempo ride to tire the legs a bit. I had intended to go for an hour, but a misplaced heart rate monitor and small Zwift Insider website emergency meant I was delayed getting on the bike. (I didn’t skip my pre-race ritual either: a piece of caffeine gum and some PR lotion on the legs.)
I settled for a 45-minute ride, averaging 230 watts around Watopia’s Figure 8 with some harder efforts included to get my heart rate up to race levels.
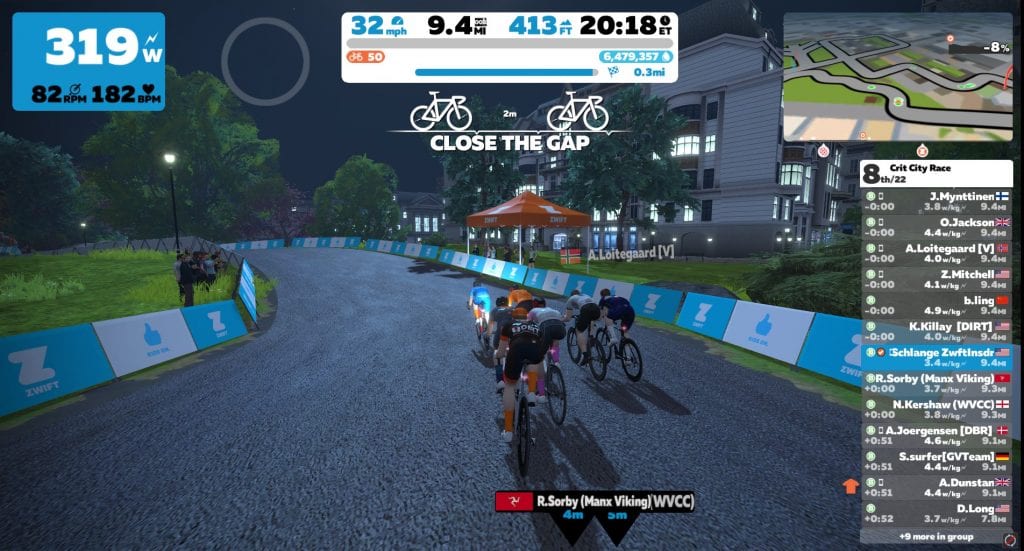
The Start
With only 22 B’s in the starting field, I knew the group speed would be a bit lower than I’ve seen with larger packs. That meant my attacks would be more fun, as I’d be able to get away a bit easier. Perhaps a few riders would join me, splitting the field into small packs with a handful of riders?
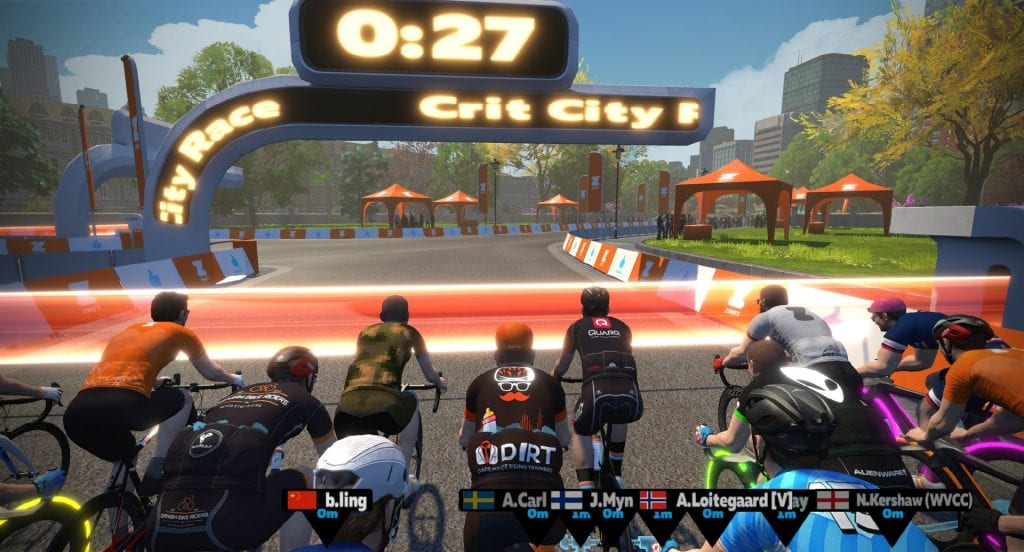
We’d find out soon enough! The clock hit zero and we were off – 8 laps of Downtown Dolphin.
Things quickly settled into the typical Downtown Dolphin rhythm: hit it hard for 15 seconds up the brick climb, keep the power up until you’re back up to speed, then recover on the rollers and flats before you do it all again 2 minutes later.
Plan of Attacks
My workout plan was to attempt an attack every other lap. Attacking on the brick prime section didn’t seem like it would work – I have a hard enough time staying in contact there as it is. And I would be a bit too gassed after the bricks to attack into the twisty descent. So I decided to attack before the bricks, on the false flat leading to the eSports pavilion. I figured nobody would expect it, and the slight false flat would help me gain a little extra ground.
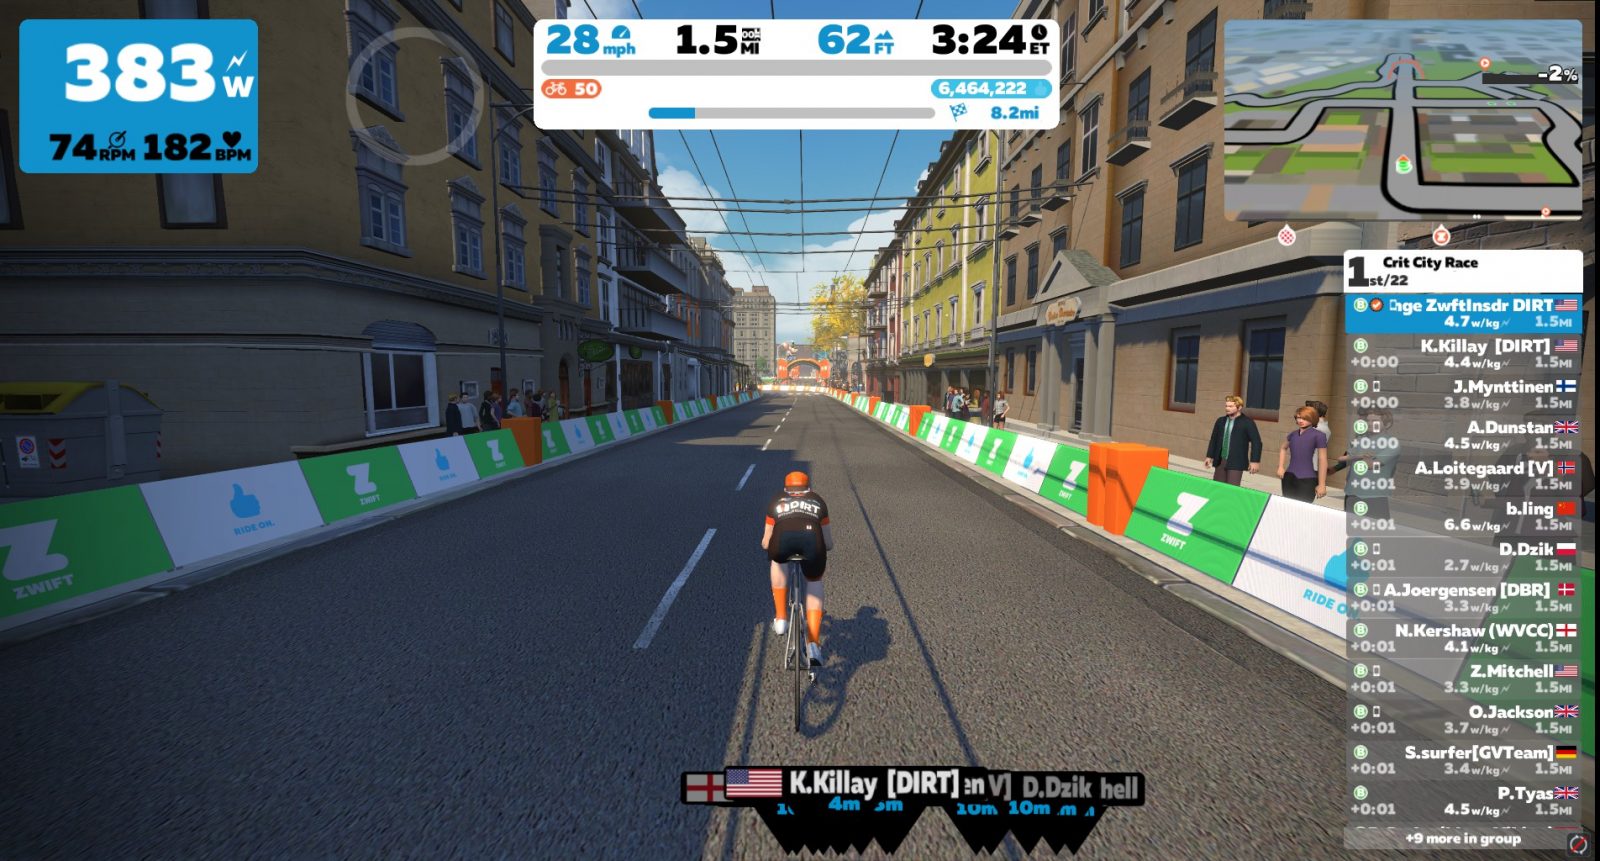
My first attack came on the second lap. I managed to get a few seconds on the group, but they caught me as we hit the bricks. (And yes, in the screenshot below, that’s a DIRT teammate at the front of the group, pulling them back to me. A big no-no! In his defense, he was probably trying to bridge up to me, although it didn’t work out that way. No big deal.)
My next attack came on the fourth lap, and this one made things interesting! I hit it hard at about the same place, but got a bit more of a gap than the first attack, probably thanks to an aero helmet powerup. The group caught me near the top of the bricks, but our pack of 13 was stretched out, with gaps opening everywhere.
As we crested the small hill and built speed into the twisties a few riders counterattacked, but I didn’t try to chase their wheels. Instead, I sat in with the larger chase group, figuring we could mop up the breakaway quickly enough. And we did!
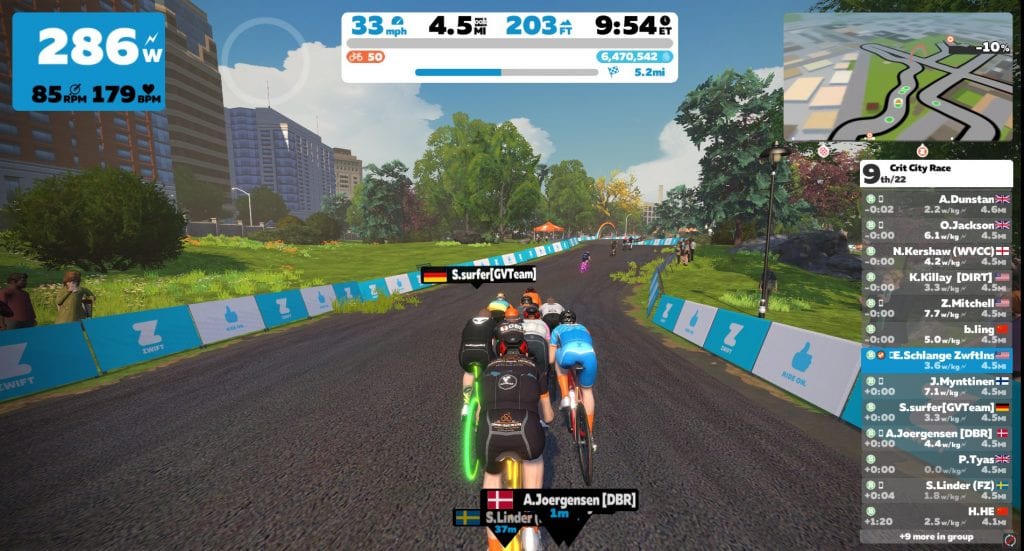
It began to feel like the pack was expecting the pace to ramp up in the section where I was attacking, so I surfed the wheels through that segment on the sixth lap, then hit it hard at the bottom of the twisties for what I hoped would be a surprise attack. It worked!
We quickly dropped a few more riders, and before we hit the bricks on the penultimate lap our front group was down to 7 riders. (Or maybe 8. There was a strong rider in a pink kit who started blinking in and out at this point in the race.)
The Finish
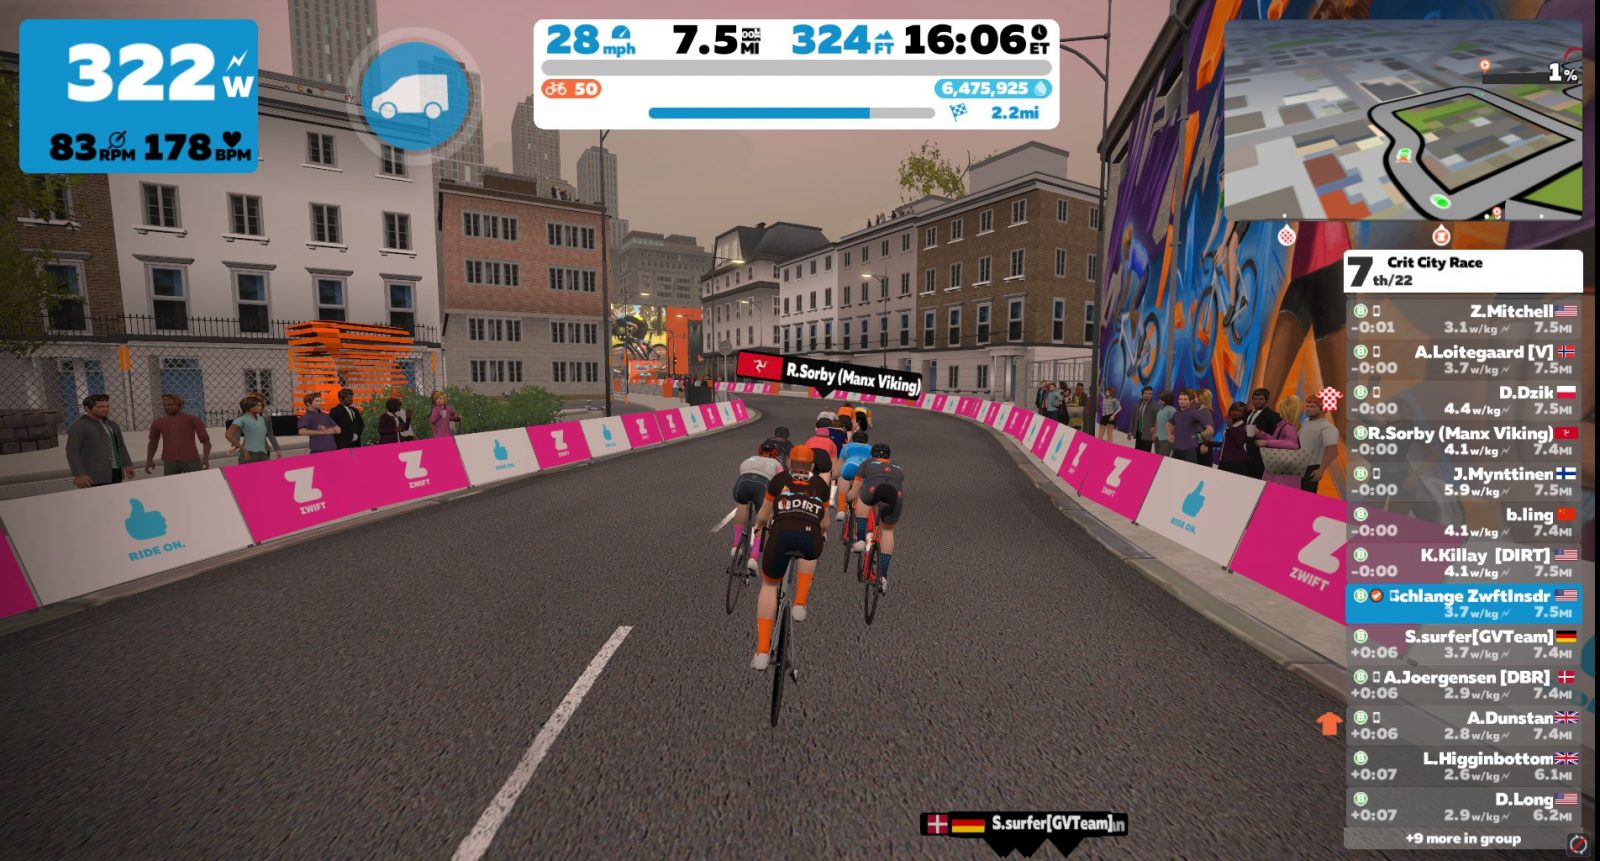
I decided my final “attack” would be the sprint to the line, so I just tried to recover and stay in contact on the last lap. When we hit the bricks, one rider (D. Dzik) went hard, breaking away from the front group. I figured we would reel him in, so I kept surfing the wheels, staying with the pack and preparing to go hard at the bottom of the twisties.
Unfortunately for us, D. Dzik has a kick! He stayed away, although just barely. I gave everything I had in the final sprint – but it wasn’t much. Looking at my stats, I only averaged ~570 watts in those final seconds, which is 100-150 watts lower than normal. Not surprising, given the matches I had already burned. (A powerup would have helped, but the Zwift gods hadn’t smiled upon me in the final laps.)
In the end, I finished 6th according to Zwift, and 5th according to ZwiftPower.
My takeaways from this race/workout are as follows:
Plan Your Work, Work Your Plan: I’ve never regretted getting up early to do my planned workout. This is what I need to tell myself each time I wake up and don’t want to get out of bed and do the work.
If you animate the race, others will too: this was the most animated short Crit City race I’ve done so far, and I really feel like my attacking off the front sort of loosened up other riders and got them to try their own attacks as well. So this was an interesting social experiment, if nothing else.
A fun way to get a hard workout: this was way more fun than setting up an ERG-mode ride and doing intervals. I had done this “racing as a workout” thing before, but it had been a while. I’ll be doing it again.
I’m stronger than I thought: I didn’t think I’d have anything left for the finish, but I ended up #5 on ZwiftPower even after riding quite “inefficiently”. That tells me I could do more attacking in real races and still survive.
The Testing Grounds
I’m reminded again of an aspect of Zwift racing that I really appreciate: it gives me a place to try new things. Zwift races are always on the calendar, there are no entry fees, and no travel time to get there. So the cost is very low – just my time and watts.
This frees me up to hop on and try new things – different strategies, different courses or equipment, or even just using the race as a workout with no intention of finishing well, like I did today. If it works out – great! If it doesn’t – that’s fine too! It didn’t cost me anything, and I completed a solid workout.
Your Thoughts
Do you ever use races strictly as workouts? How do you structure things? I’d love to hear your thoughts and stories… comment below!
Runners, don’t miss the return of the Watopia Run Festival presented by Maurten. It’s two days of fun for runners of all fitness levels, and it happens this weekend, February 22-23!
Make it a fun run, or push yourself to the limit. It’s up to you! While there’s no podium at the end of the Watopia Run Festival, each event will show a finishing order once completed.
Events
There are four different event lengths to choose from. The first three (One Mile Fun Run, 5k, and 10k) happen on Saturday at multiple times, while the Half Marathon happens on Sunday (again, at multiple times). Choose one event, or run in multiple:
Complete any of the Watopia Run Festival events and be entered for a chance to win 1 of 10 Maurten Prize packs. These prize packs include a variety of Maurten’s innovative hydrogel technology sports drinks and gels, a Maurten water bottle and Maurten T-shirt.
Kit Unlock
Just finish one event, and the stylish in-game 2020 Watopia Run Festival kits is all yours.
The “Richmond Rollercoaster” route was launched as part of the Richmond refresh in February 2020. It’s a “lollipop route”, meaning you ride a lead-in to the route’s main circuit, then ride a certain number of laps of the circuit. This route’s lead-in is a wild one, though – hence the “rollercoaster” name!
After the lumpy rollercoaster lead-in you’re on a flat circuit that begins and ends at the Monument Avenue sprint banner. This circuit is the reverse version of The Fan Flats circuit.
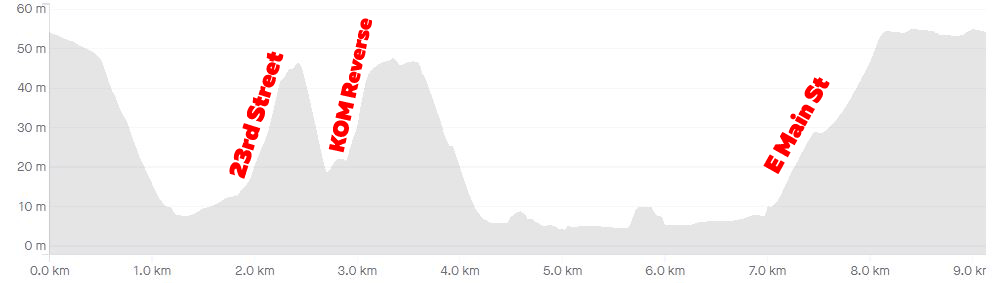
The “rollercoaster” portion of this route is essentially the hilly parts of the Cobbled Climbs Reverse route. So you begin on a slight descent near Richmond’s start/finish banner, but the road quickly gets steeper down Governor Street. Enjoy the free speed now, because as soon as you get to the bottom the 23rd Street KOM section begins. This timed climb ends at the 23rd Street KOM banner.
A quick descent down 23rd St takes you onto the start of the second (and final) timed KOM of this route, simply called the “KOM Reverse” in game. This climb starts off very steep, hitting 22% (the steepest pitch in Zwift?) around the first right-hand bend before leveling into a false flat to the KOM banner atop Libby Hill.
Richmond Rollercoaster Route Profile: 1 Lap
Next you’ll fly down the twisty cobbles of Libby Hill to the waterfront for the flattest portion of the course, which is approximately 2.5km long with a few rollers. This brings you to the final climb of the route, up East Main Street. It’s the longest climb on the loop (1.2km at 3.8%), but is not a timed KOM segment.
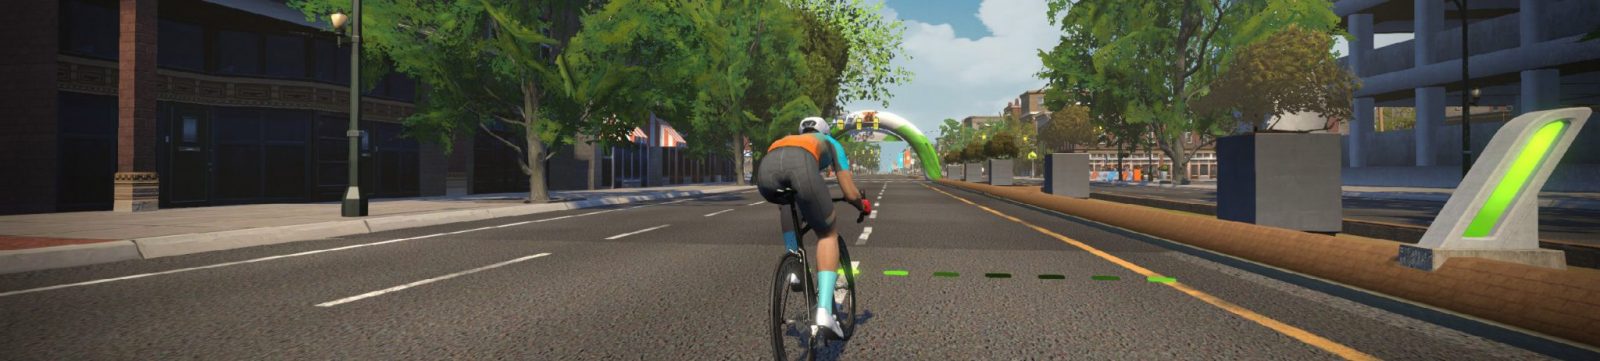
After the rollercoaster, you’ll make your way onto the flat circuit portion of this route for as many laps as your event organizers have planned. Before you hit the circuit, though, you’ll have one go at the reverse Broad Street sprint – the shortest timed sprint in Zwift!
Broad Street reverse sprint – the shortest sprint in Zwift!
Race Strategy
This route will lead to exciting races, as the pitchy lead-in lends itself to breakaways by strong climbers while the flat circuit finish should let a high-wattage pack reel in small breakaways. Smart racers will need to look at multiple variables to figure out their best strategy, such as:
How strong are you on climbs vs flats?
How many flat circuit laps are in the race?
How many riders are in the breakaway group(s) vs chase groups?
About Lap Counts and Distances
The laps begin and end at the Monument Avenue sprint banner, meaning you’ll have a ~12km (7.5 mile) lead-in with 151m (495′) of climbing before your first lap begins. Each flat circuit lap is 5km (3.1 miles) long, so a 1-lap race here will be 12+5=17km long, while a 2-lap race would be 12+5+5=22km long, etc.
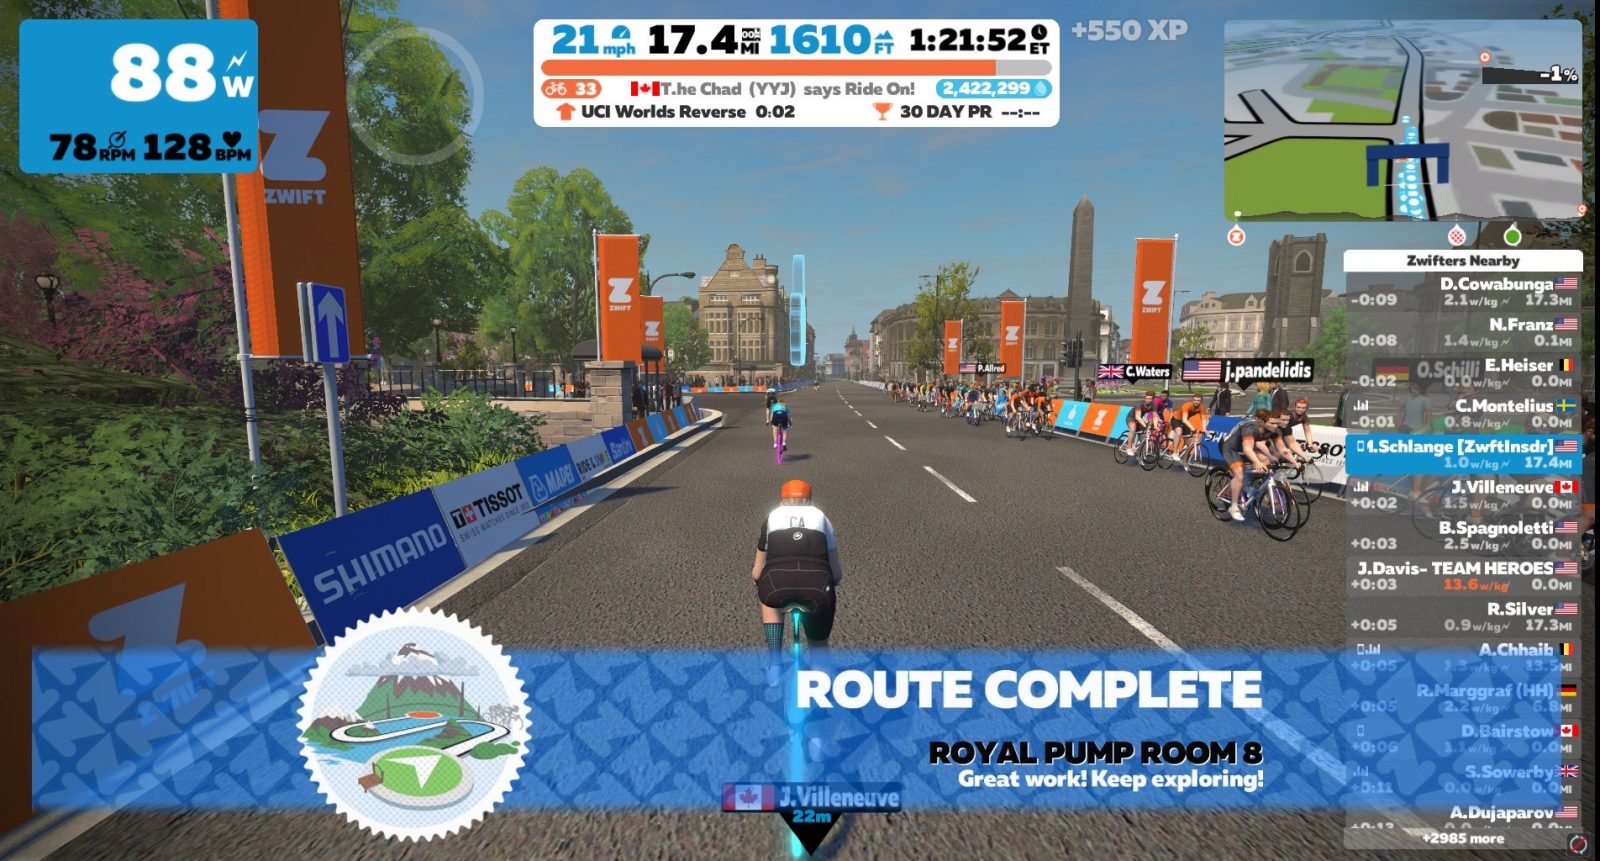
Editor’s note: Monica is undertaking the “Couch to Route Hero” challenge of riding all 67 “free-ridable” Zwift routes (and getting all the badges) in 11 weeks. Each week she shares her story of the previous week’s struggles and accomplishments. Follow along on her journey, take the challenge yourself, and be sure to give her a Ride On if you see her on course!
If I had written this article on Tuesday afternoon it would have just said “I don’t want to do this anymore.” The rest of the page would have been blank. Of course, that wouldn’t make for a very encouraging read, plus I had easier rides later in the week. So I am here with a full write up!
The Rides Lined Up
6 more badges were added this week for a total of 42! All of the 1 bidons are officially done. Only 25 routes left!
I rode 119.89 miles with 7,829 feet of climb in 8 ½ hours on my bike this week. Mercy!
As you may have guessed The London PRL Half is what made me want to quit this quest. (Quite encouraging to those of you who haven’t ridden it, I’m sure!) It’s 4 laps of the London Loop, which means climbing Box Hill 4 times! I chose to do this route for my 4 bidon day, even though there are easier 4 bidon routes to do. I knew that in the coming weeks when I’m doing 5+ bidon routes I wouldn’t want to ride this one, so I got it out of the way early.
The first 3 laps weren’t actually that bad. I put on some lively music and tried to keep a steady pace in Zone 3. I ended up improving my time up Box Hill each lap by just a bit. Things were going swimmingly!
As I started the last loop I realized I needed to be at a meeting sooner than I thought. And I knew I had more oomph in me than needed for just one last lap so I pushed myself to the max. It wasn’t my best idea.
The great part about this push is that I got a new 30-day PR up Box Hill (42 seconds faster than the lap before) and I also got one on the London Loop (by 16 seconds)! As I was descending Fox Hill though it became abundantly clear that I had given everything I had. My lower back all the way down to my left knee was hurting, some of my toes were numb, my neck ached and I had no energy in me. The problem is, the start/finish banner wasn’t the end of the route! You have to ride to the Surrey Roundabout, and then go under the banner in The Mall to really be done! I didn’t save anything for all of that. There was a lot of pain and whining at the end of my ride!
Here’s what I’m trying to say, friends: Save a little something for the last part of the journey (and don’t forget what time your meetings start)!
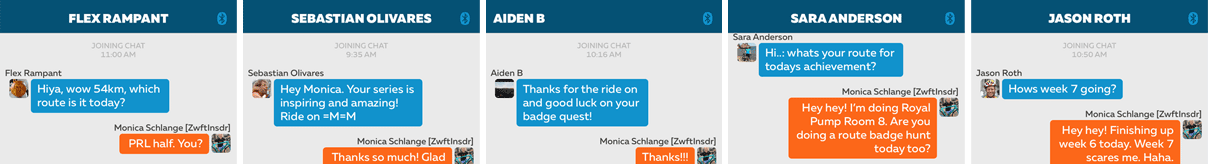
The Encouragement from the Community
Every ride I was on this week had someone sending me an in-game message asking what route I was doing and encouraging me in some way. It was INCREDIBLY motivating! And also distracting, which is perfect!
If you’ve ever found it quiet and lonely on some of your rides just send an in-game message to those around you asking them what route they’re doing. Or ask if there are others who are also wanting to chat. It’s likely someone else could use the personalized community time too!
Coming Up Next
Has anyone noticed yet that week 7 includes TWO 5+ bidon routes? This may be the last article I ever write, depending on how those go. I have decided I’m not quitting, so unless I flat out die on the bike I’ll be back here next week with an update!
How about you?
I LOVE hearing from you all! How many route badges do you have now? Have you done the PRL Half? If so, how did it go for you? What tips do you have for others?
It’s fun getting Ride Ons from those of you following the quest!

")