I’ve been spending a lot of time getting intimate with Zwift route data lately. Why? Two separate projects. One that predicts your finishing time on a given route… the other that tracks those times on a leaderboard against others!
Here are the details…
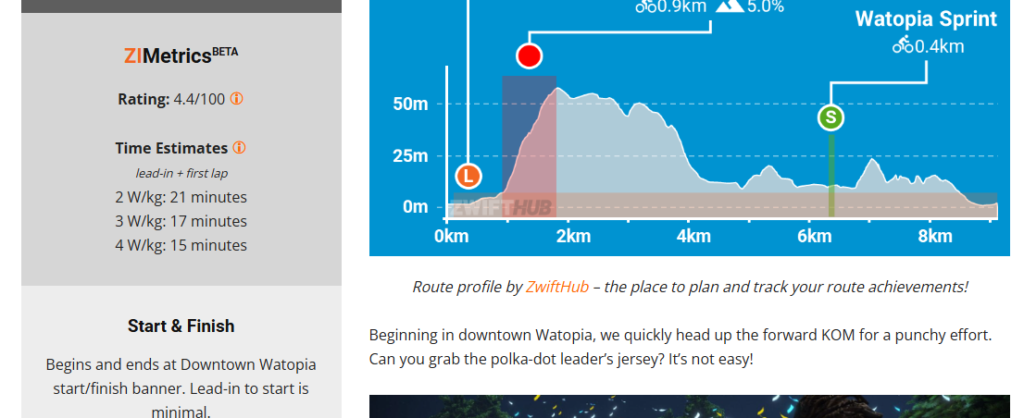
Introducing ZIMetrics

For years, I’ve wanted to add two things to Zwift Insider’s route detail pages:
- A route difficulty rating: something easy to understand, which can be used at a glance to rank Zwift’s entire universe of routes
- Route completion time estimates based on your power output: it’s not always easy to glance at a route’s length and elevation and figure out how long it will take you to complete, and Zwift’s in-game estimates aren’t always helpful. But most Zwifters know what sort of watts per kilo they can sustain for a given amount of time, so if I could calculate accurate time estimates for a given w/kg, that seemed like it would be helpful.
I’ve been tweaking and testing an algorithm for a few weeks, and I’m pretty happy with its results at this point – hence this announcement.
Time Estimate Notes
Let me start by saying this: there’s no way to estimate a perfectly accurate completion time on Zwift – not unless it’s a TT race and you’re perfectly following a particular “power plan” à la BestBikeSplit.
My goal with these time estimates is to predict how long it would take a semi-experienced rider, riding efficiently in a group, to finish one lap of the course, including any lead-in. The algorithm assumes you’re a 75kg, 183cm rider drafting on the flats, on a decently fast bike, and pushing harder on climbs than on flats and descents.
Basically, the algorithm is based on a typical Zwift group ride or race situation.
Of course, draft conditions vary widely, as do rider height/weight, choice of bike, and power variability. In order to keep it simple and avoid requiring people to enter height, bike choice, etc, I had to make certain assumptions, and I’m fine with that, because I don’t think we lost much accuracy in doing so. In my tests, I’m finding that the ZIMetrics estimates are almost always within 3% of the actual completion time. That’s certainly close enough for our purposes.
Route Rating Notes
Each route also has an objective “Rating” score between 0-100. This is simply a normalized version of the time estimates above. For example, if ZIMetrics estimates that a route will take 40 minutes to complete, that means it will have half the rating of a route that is estimated to take 80 minutes to complete.
Yes, it’s not a perfect metric. But I’m not sure such a metric exists. The ZIMetric route rating is a simple way to rank routes against each other.
I’ll be using this to compute the bidon score for the printable routes by difficulty page, once I’ve got all the routes updated. (That’s why this printable list hasn’t been updated for a few months, by the way…)
I should note that I’ve set it up so the current highest-rated (that is, the toughest) route – London’s “The PRL Full” – is rated at 100. If a tougher route gets released all scores would get automatically recalibrated based on the new maximum.
Not All Routes… Yet
ZIMetrics aren’t yet available for every route, because I have to edit each of the 236 routes in the database to include specific, accurate data before the ZIMetrics algorithm can spit out good results.
Here’s the complete list of routes that have ZIMetrics enabled (90+ routes currently). That list should continue to grow daily until all routes are finished.
VeloViewer Leaderboards Update

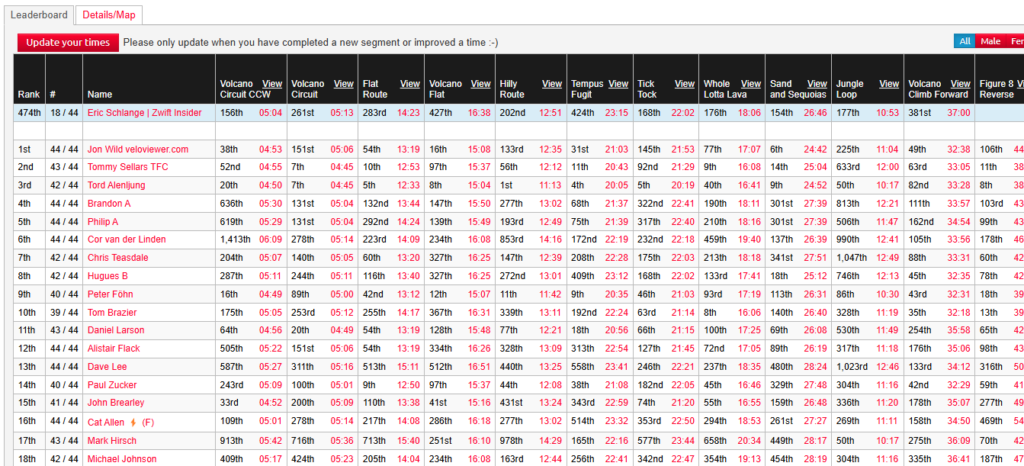
Our Route Hunter Leaderboards p/b VeloViewer, have been very popular since they were first launched in the middle of Covid craziness on August 18, 2020.
If you aren’t familiar with these leaderboards, they basically allow you to compete for overall fast time across a combined set of Zwift routes and KOMs. It’s a fun way to pit yourself against others, track your completion of routes, and see your own fitness progression.
These leaderboards are now updated with the latest routes and KOMs.
Questions or Comments?
Share below!