

This week, GCN partnered with Zwift to produce a video analyzing millions of power data points from Zwift users gathered over the past 12 months. The data, when combined with users’ weight, age, and gender, helps answer a few common questions cyclists ask, especially:
- How fit am I compared to the universe of cyclists?
- How does my fitness change with age?
Here’s the full video… a quick and worthy watch before we dig into the numbers below:
Finding Your Data
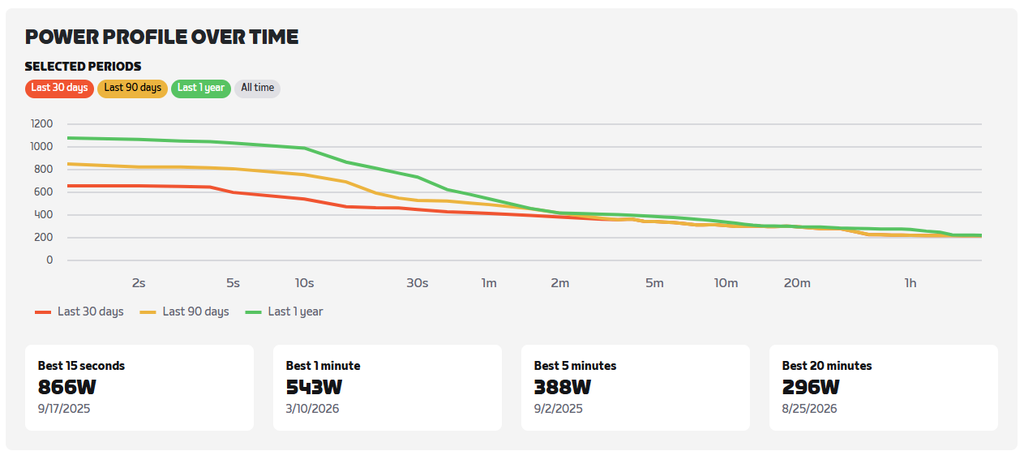
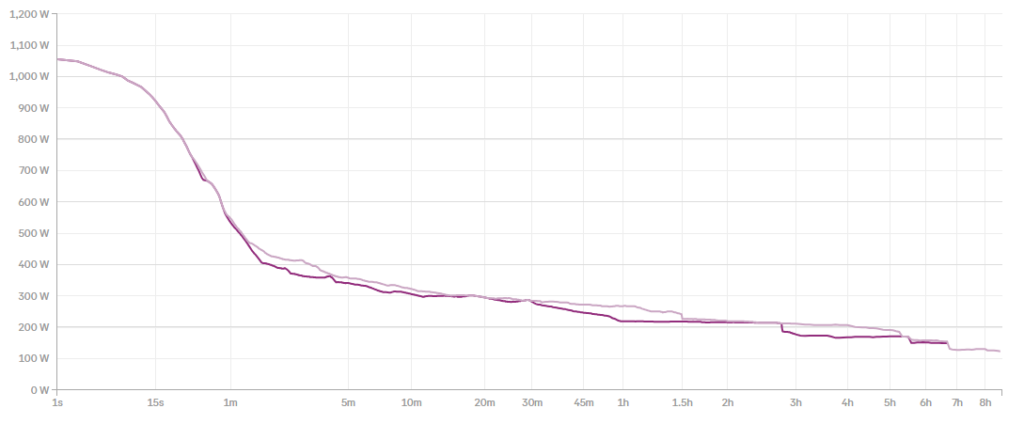
To compare yourself to the stats presented in the video, you will, of course, need to know your numbers! These can be found just about anywhere you send your cycling data, including Zwift and Strava:
- Zwift shows your Power Profile Over Time (a new feature!) at zwift.com/feed (click MY PROFILE, then POWER)
- Strava subscribers can see their Best Efforts Power Curve under Training>Power Curve (strava.com/athlete/analysis)
It’s worth noting that Dan mentions a very valid caveat to the accuracy of the data presented in the video. The data is pulled from Zwifters’ activities over the past 12 months, but we don’t know how many of those riders have actually completed max efforts at the four durations below. It’s likely that the actual max-effort numbers for the Zwift population are a bit higher than what you see below.
With that said, here’s the Zwift data presented in the video, so you don’t have to hit pause while calculating your values…
5-Second Power
Male
| Age Group | Bottom 10% | Average Rider | Top 10% |
| 20-29 | 4.16 W/kg | 8.75 W/kg | 14.06 W/kg |
| 30-39 | 3.94 W/kg | 8.21 W/kg | 13.00 W/kg |
| 40-49 | 3.91 W/kg | 7.96 W/kg | 12.42 W/kg |
| 50-59 | 3.74 W/kg | 7.36 W/kg | 11.32 W/kg |
| 60-69 | 3.44 W/kg | 6.56 W/kg | 9.99 W/kg |
| 70-79 | 2.85 W/kg | 5.52 W/kg | 8.41 W/kg |
Female
| Age Group | Bottom 10% | Average Rider | Top 10% |
| 20-29 | 3.41 W/kg | 6.53 W/kg | 10.42 W/kg |
| 30-39 | 3.12 W/kg | 6.01 W/kg | 9.49 W/kg |
| 40-49 | 3.09 W/kg | 6.00 W/kg | 9.30 W/kg |
| 50-59 | 2.95 W/kg | 5.60 W/kg | 8.50 W/kg |
| 60-69 | 2.73 W/kg | 5.12 W/kg | 7.57 W/kg |
| 70-79 | 2.37 W/kg | 4.36 W/kg | 6.47 W/kg |
1-Minute Power
Male
| Age Group | Bottom 10% | Average Rider | Top 10% |
| 20-29 | 2.88 W/kg | 4.75 W/kg | 6.82 W/kg |
| 30-39 | 2.74 W/kg | 4.52 W/kg | 6.47 W/kg |
| 40-49 | 2.68 W/kg | 4.37 W/kg | 6.21 W/kg |
| 50-59 | 2.54 W/kg | 4.05 W/kg | 5.70 W/kg |
| 60-69 | 2.34 W/kg | 3.67 W/kg | 5.09 W/kg |
| 70-79 | 1.97 W/kg | 3.18 W/kg | 4.44 W/kg |
Female
| Age Group | Bottom 10% | Average Rider | Top 10% |
| 20-29 | 2.42 W/kg | 3.86 W/kg | 5.45 W/kg |
| 30-39 | 2.24 W/kg | 3.63 W/kg | 5.13 W/kg |
| 40-49 | 2.20 W/kg | 3.58 W/kg | 5.02 W/kg |
| 50-59 | 2.08 W/kg | 3.36 W/kg | 4.71 W/kg |
| 60-69 | 1.92 W/kg | 3.09 W/kg | 4.29 W/kg |
| 70-79 | 1.67 W/kg | 2.71 W/kg | 3.84 W/kg |
5-Minute Power
Male
| Age Group | Bottom 10% | Average Rider | Top 10% |
| 20-29 | 2.27 W/kg | 3.63 W/kg | 5.10 W/kg |
| 30-39 | 2.15 W/kg | 3.41 W/kg | 4.73 W/kg |
| 40-49 | 2.10 W/kg | 3.28 W/kg | 4.51 W/kg |
| 50-59 | 1.99 W/kg | 3.05 W/kg | 4.16 W/kg |
| 60-69 | 1.82 W/kg | 2.78 W/kg | 3.76 W/kg |
| 70-79 | 1.54 W/kg | 2.43 W/kg | 3.34 W/kg |
Female
| Age Group | Bottom 10% | Average Rider | Top 10% |
| 20-29 | 1.95 W/kg | 3.07 W/kg | 4.28 W/kg |
| 30-39 | 1.81 W/kg | 2.88 W/kg | 4.02 W/kg |
| 40-49 | 1.77 W/kg | 2.82 W/kg | 3.89 W/kg |
| 50-59 | 1.69 W/kg | 2.65 W/kg | 3.65 W/kg |
| 60-69 | 1.56 W/kg | 2.45 W/kg | 3.36 W/kg |
| 70-79 | 1.36 W/kg | 2.15 W/kg | 2.89 W/kg |
20-Minute Power
Male
| Age Group | Bottom 10% | Average Rider | Top 10% |
| 20-29 | 1.95 W/kg | 3.09 W/kg | 4.32 W/kg |
| 30-39 | 1.86 W/kg | 2.93 W/kg | 4.05 W/kg |
| 40-49 | 1.83 W/kg | 2.84 W/kg | 3.89 W/kg |
| 50-59 | 1.73 W/kg | 2.67 W/kg | 3.63 W/kg |
| 60-69 | 1.61 W/kg | 2.45 W/kg | 3.32 W/kg |
| 70-79 | 1.36 W/kg | 2.16 W/kg | 2.97 W/kg |
Female
| Age Group | Bottom 10% | Average Rider | Top 10% |
| 20-29 | 1.69 W/kg | 2.65 W/kg | 3.70 W/kg |
| 30-39 | 1.57 W/kg | 2.51 W/kg | 3.50 W/kg |
| 40-49 | 1.55 W/kg | 2.47 W/kg | 3.42 W/kg |
| 50-59 | 1.48 W/kg | 2.34 W/kg | 3.22 W/kg |
| 60-69 | 1.38 W/kg | 2.18 W/kg | 3.00 W/kg |
| 70-79 | 1.19 W/kg | 1.92 W/kg | 2.69 W/kg |
Additional Metrics
The video above also shares some simple graphs showing additional data:
- How much our power output changes with age
- How much our weight changes with age
As I said… well worth a watch.
Your Thoughts
So how do you measure up? I managed to make the top 10% for my age group (40-49) in 1-minute and 5-minute power, but fell just short in 5-second power and well short in 20-minute power. (Interestingly, this is quite a different result from when I compared my data using ZwiftPower’s rider phenotypes charts back in 2020. Either I’ve changed, the population data has changed, or both. Or maybe it’s time for a 20-minute power test?)
Share your results and any other thoughts and questions below!

My body is old 63 plus, but my mind says it’s still 43 and I can do it.
Then the body takes back over and I can’t do it at all! 😳 😁
Huge grain of salt. Are you using a well-calibrated trainer setup or a twenty year-old mountainbike with straps? How does weight play into this? How many Zwifters are lying about their weight? As you say, how many have actually tried to max out each time vs riding for fun?
Too many confounding factors in both directions for this to count for much. It’s an interesting set of numbers, but I wouldn’t take much from it.
I wonder how far right average vs median is skewing the numbers toward the right. You can kinda see it in the numbers above with the step from bottom 10% >> Avg >> top 10%. More so in the men’s cos we are nothing without our egos 😜 Speaking of which, all the Zwift watt monsters need to clam down a bit, you’re making the rest of us look less than average 😎
Before 2020, in my low 40s, I was top 10% in sprint (5sec, and almost 10% in the other 3 metrics)
At 51, restarting after a few years low riding I was around avg or below avg. Now all was put on hold again after breaking the hip while skiing. Hopefully I get back to my numbers in the 40s
“It’s not the years, it’s the mileage.” -Indiana Jones
69 yrs old. Slightly above average for 5 sec and 1 min. Slightly below average for 5 and 20 min.
I am average up to 5 min and start tailing off. Note that my VO2max and Lung capacity are very low…20-25% as a life-long asthmatic. Supposedly I have a “concave” chest per an Air Force doctor when I was young (8-10 years old).
I am 64 (65 in Jan) and push myself as much as possible. I definitely need more Z2 rides but somehow cannot help myself.
I seem to be a distinctly average 32 year old, despite my 300lbs build. Watch out on the flats!
My weakest category is 5 second power and I do better as the duration goes up.
With regards to the comments about poor setups, incorrect weights etc my take is that Zwift has a big enough dataset that they don’t really matter in the grand scheme of things. The numbers in general give you an idea whether you’re closer to the bottom or top and whether your numbers are consistent or if you have a particular strength or weakness
Thank you Dan for reenforcing how much I suck. If anyone needs me I’ll be Watopia.
At 63 can still get within 100 watts of my all time top, but alas it is just like my IRL racing career 30 years ago. Can’t stay with the lead group to actually sprint 🤔
By the time I get to ftp I’m back to a mere mortal. Just don’t have the heart beats anymore. Top out at 165 now as opposed to 185 in my 30’s.
Those 20 beats mean everything. You’ll miss them when they’re gone 😥
I’m 53 and 107 KG.
5s 9.42 w/kg
1m 6.61
5m 4.10
20m 3.47
my 5 second is about halfway between average and top 10%. My 1 min is above the top ten (I remember the effort, and I don’t look forward to trying to beat it). My 5 min and 20 min are just below the top 10%.
i feel pretty good about those numbers considering I only really started about a year and a half ago, and was heavier and slower then.
Another great resource is intervals.icu which has a power tab, which can show your power sliced and diced as you please. It’s free, although I think importing all your historical data requires a cheap fee. For men 50-54 there are 7516 athletes so a big enough data pool. Beware, the comparisons are less flattering than the Zwift numbers….
20 minutes is the best indicator of your “endurance” on this chart.
so, power curve is a new feature? why can’t they display W/kg? this number is essential in game for all their implemented kinetics. but since they still display many UOMs wrong I don’t wonder anymore.
12 Years old, about 0.10w/kg above average in all numbers
for a 20 year old
If one would also add insights into training volumes, it would give much better understanding. Close to pointless to compare a person with 1 hour/week vs a person doing 15 hours/week. I’m still puzzled that this aspect is never mentioned, covered or even considered since it gives the biggest difference. I understand this data might have been hard to fetch in the past but at least we now have the Zwift Training score, even if not perfect, 1000% better than nothing. Strange that the effort is not considered, only the result, as if all humans are born equal and only age/weight/gender matters.
I am also very certain that if one would group riders based on training volume, then add the age aspect, then the physical age-decline would not be as steep as everyone believes. I think as getting older, people lower their training volume/intensity far more than the contribution by the age component itself.
Being 79 in a couple weeks, one of the things I found interesting is that a Top 10% 70-79 year old is roughly equivalent to an average 30-39 year old in all tables. Personally, I fall right at or slightly above the 70-79 Top 10% in all durations – using my true ~70kg weight.
My data come from my best 2026 power efforts as recorded in Training Peaks and are all outdoor activities done at an altitude of 6,000,-8,000′ in the Denver area/foothills vs Zwift rides.
Agree needs to be taken with a pinch of salt as I suspect it is missing a lot of max effort data. However it is a good 15 mins watch.
I am 61, a regular Zwifter for 5 years and also an occasional runner for 9 years. Parkrun and WTRL Duathlon once a week only, and ride 200-250 miles a week Zwift riding with 2-3 max efforts a week.
I went on a diet and lost about 20 kgs after I started Zwifting and this was undoubtedly when my biggest performance improvements occurred. Now is all about maintaining that level of performance.
Interestingly I have noticed my ride racing stats have dropped a little over the past 12 months, still just inside the top 10% for 5/20 mins. However running has not dipped and my Parkrun age related % has actually improved in the past month, possibly down to a new running shoe.
Whatever the reasons these are relatively small gains/loses. For me the Government advice of lose weight and exercise more for most people is simple and works.
This is really interesting and I am pleased to see that I am within the 10% for 1 min power and just outside it in all other metrics. Gives me some reassurance that I am going in the right direction, despite my advancing years!
Makes me feel pretty good about myself! I started zwifting 3 yrs ago. im now 42. I was an average D cat rider at the start.. today im winning A cat rides and EASILY in the top 10% on every power metric on your charts. some im top 10% a couple of age groups younger than my age!
It did take 3 years of hard training literally every day to get here though to be fair.
Im and Old Man living in a Young body hahahaha 😂
Disappointed that there are no stats for 80-89 (better yet, 80-84 and 85-89, because you lose it faster at those ages). Surely there are plenty of Zwifters in their 80’s from whom you could draw data? I am 80, I train as hard as I can, yet I fall below the bottom 10% of 70-79. But by other measurements, I am very fit for my age.