Cycling is a voyage of self-discovery. While it teaches us a lot about how we think it also teaches us so much about our physical selves. How much recovery do I need? How strong am I at different types of efforts (sprints, endurance rides, etc)? And how do my physical strengths rank against others?
Thanks to the universe of data amassed by ZwiftPower, Zwifters have a powerful, free tool at our fingertips to help us better understand our physical selves. But before we dig into that, let’s lay a foundation.
Rider Phenotypes
“Rider phenotypes” categorize cyclists based on their maximum average power over different time periods, also known as “critical power”. The time periods vary from book to book or coach to coach, but one popular model uses 5 seconds, 1 minute, 5 minutes, and FTP. A rider’s power numbers may be placed on a graph, creating something like this:
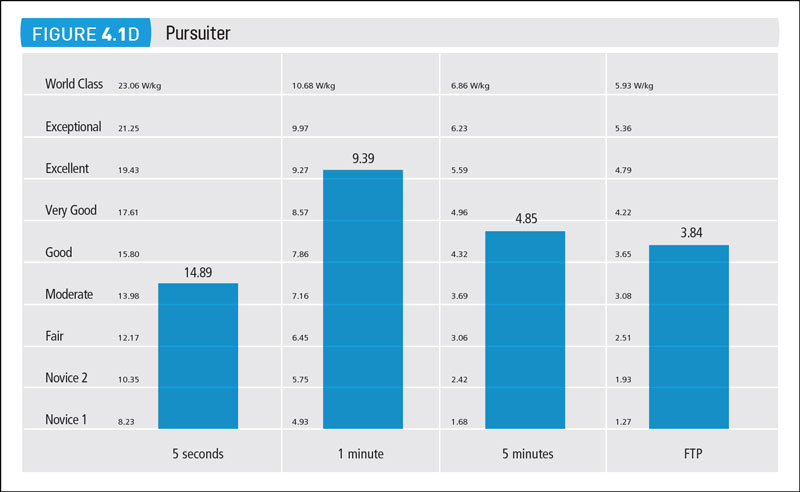
chart from Training and Racing with a Power Meter, 3rd Edition
In Training and Racing with a Power Meter the authors define the following phenotypes:
- All-Rounder: generally even across all four time periods.
- Sprinter: downsloping plot with best power in the 5s range
- Time Trialist, Climber, or Steady-State Rider: upward-sloping plot with best power in the FTP range
- Pursuiter: an inverted V-shaped plot with the peak in the 1-minute range
What’s Your Phenotype?
Here’s the fun part: ZwiftPower displays critical power charts on the profiles of each ZwiftPower user, allowing us to see where our strengths and weaknesses lie. Just view your profile page (here’s mine) and look at the graphs directly below your profile pic. Here’s what mine looks like today:

Mouse over each bar for a little more detail, including a percentile ranking against the overall cycling population using Cycling Analytics’ numbers found here. (This percentile grade is split by gender.)
The bars on the left display your power numbers in w/kg, while the bars on the right display them in pure watts.
Your best three bars in terms of population percentile rank are color-coded – these are your strongest points. Orange is your best, dark blue second best, light blue third best. So in my profile, my best is 20-minute wattage, followed by 5-minute and 1-minute.
A Word about Data Quality
It’s worth noting that your phenotype charts will only be as good as the data fed into them. ZwiftPower uses your last 90 days of group ride data for its phenotype charts, so if (for instance) you haven’t put in a hard 20-minute effort in the last 90 days, your chart may show you as a weak Long Climber or Time Trialist even though you may be very strong. And keep in mind this is only for events set up on ZwiftPower, which means your free rides or personal workouts won’t be included.
If you are regularly participating in all-out Zwift races of varying lengths your charts should be quite accurate.
Using the Data: Racing
A quick glance at a Zwifter’s chart can tell us what sorts of race situations suit them best. In my chart above we can see that, first of all, pure wattage is my strength. Power to weight (w/kg) is not! So I’ll do better on flatter courses, where wattage determines speed more than w/kg. Since my 20-minute power is my biggest strength (69.98% rank), I’m looking for flat TTs, or road races where the pace stays high throughout and there is a lot of attrition as riders drop off.
Now look at my weakest bar: 5-minute w/kg of 4.46w/kg (49.22% rank). My chart says that if a race involves a substantial climb in the 5+ minute range, I will struggle to stay with the front riders. And guess what: that’s true!
Contrast my chart above with the current world top-ranked Zwift racer, Stefan Kirchmair:

You’ll notice his best numbers are all on the w/kg side, indicating he excels in races with substantial climbs. His 20-minute power of 5.79 w/kg places him in the 98.66% rank, indicating that very few riders can beat him on long climbs. This is the power profile of a rider who is nearly unbeatable when the road tilts upward!
Not all top racers are lightweight climbers, though. Holden Comeau is the 2019 Zwift USA National Champion, currently ranked 3rd in the world. Check out how different his profile is from Stefan’s:

Holden doesn’t win races by attacking on long climbs – he sits in the pack and wins in the final minute with a super-strong ramp up punctuated by a blistering sprint. With 1-minute power of 768 watts (99.07%) and 15-second power that is ranked over 98% both in pure watts and w/kg, Holden is a rider you have to shake off well before the finish if you want to win!
Holden vs Stefan
If Holden and Stefan raced against each other they could use these critical power charts to come up with a plan and give themselves the best chance at a win. Let’s say they were racing Watopia’s Mountain 8, which begins with a climb up the reverse Epic KOM and radio tower (~18 minutes), then descends to a flat finish of approximately 9km.
- Stefan would want to get away from Holden on the climb, putting as much time into him as possible while the road is steep. Then he would want some high-wattage teammates to tow him to the line, keeping him well ahead of Holden so it doesn’t come down to a head-to-head sprint.
- Holden would want to limit his losses on the climb, perhaps using teammates to lend a bit of draft and pacing. Then he would want teammates on hand to help him reel Stefan back in on the descent and final flat portions of the race, forcing the race to end in a head-to-head sprint.
Using the Data: Training

Just as the phenotype chart tells you your strengths, it also tells you where you are weakest. Coach Shayne Gaffney says “race your strengths, train your weaknesses.” Even if you aren’t working with a coach, you can use these charts as a simple guide to spot your weakest points.
I know I need to work on my 5-minute power while dropping a bit of weight. What about you?
If you’re looking for a resource to help you train, check out the latest edition of Training and Racing with a Power Meter. The other book I’d highly recommend is “The Cyclist’s Training Bible” by Joe Friel. This is a very well-respected resource from one of the most trusted cycling coaches in the world.
Conclusion
There’s much more we could discuss with these rider phenotype numbers, but I hope this gets you started. Questions or comments? Post below!
