Cycling is a voyage of self-discovery. While it teaches us about how we think (what drives us, what level of suffering can we endure, what level of training structure works best) it also teaches us so much about our physical selves. What kind of recovery do I need? How strong am I at different types of efforts (sprints, endurance rides, etc)? And how do my physical strengths rank against others?
Thanks to the universe of data amassed by ZwiftPower, Zwifters now have a powerful, free tool at our fingertips to help us better understand our physical selves. But before we dig into that, let’s lay a foundation.
Rider Phenotypes
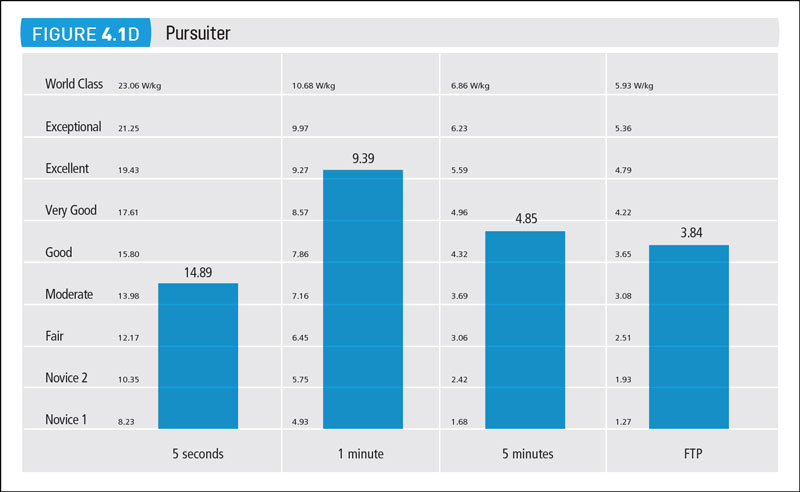
“Rider phenotypes” categorize riders based on their maximum average power over different time periods. The time periods vary from book to book or coach to coach, but one popular model uses 5 seconds, 1 minute, 5 minutes, and FTP. A rider’s power numbers are placed on a graph, creating something like this:

chart from Training and Racing with a Power Meter, 3rd Edition
In Training and Racing with a Power Meter the authors define the following phenotypes:
- All-Rounder: generally even across all four time periods.
- Sprinter: downsloping plot with best power in the 5s range
- Time Trialist, Climber, or Steady-State Rider: upward-sloping plot with best power in the FTP range
- Pursuiter: an inverted V-shaped plot with the peak in the 1-minute range
What’s Your Phenotype?
Here’s the fun part. ZwiftPower displays phenotype charts to the profiles of each ZwiftPower user, allowing each of us to see where our strengths and weaknesses lie. Just view your profile page (here’s mine) and look at the graphs directly below your profile pic. Here’s what mine looks like today:
Your best three bars are color-coded–these are your strongest points. Orange is your best, dark blue second best, light blue third best.
The bars on the left display your power numbers in w/kg, while the bars on the right display them in pure watts.
Looking horizontally:
- Row 1 (Uphill Sprinter/Short Sprinter) is your 15-second power
- Row 2 (Short Climber/Long Sprinter) is your 1-minute power
- Row 3 (Medium Climber/Rouleur) is your 5-minute power
- Row 4 (Long Climber/Time Trialist) is your 20-minute power
Mouse over each bar for a little more detail, including a percentage ranking against the overall cycling population using Cycling Analytics’ numbers found here. This percentile grade is split by gender.
A Word about Data Quality
It’s worth noting that your phenotype charts will only be as good as the data fed into them. ZwiftPower uses your last 90 days of group ride data, so if (for instance) you haven’t put in a hard 20-minute effort in the last 90 days, your chart may show you as a weak Long Climber or Time Trialist even though you may be very strong. And keep in mind this is only for events set up on ZwiftPower, which means your free rides or personal workouts won’t be included.
If you are participating in all-out Zwift races on a monthly basis or more your charts should be quite accurate.
Using the Data: Racing
A quick glance at a user’s charts tells us what sorts of race situations suit them best. In my chart above we can see that I’m looking for races which come down to a long sprint on a flat road (my “Long Sprinter” bar is orange, which means it’s my top strength, putting me in the 76th percentile against the universe of cyclists). That means I’ll do best staying in the pack and conserving, waiting to pounce in the final ~60 seconds of the race, as long as the finish isn’t uphill.
Now look at my weakest bar: “Medium Climber” at 4.36w/kg of 5-minute power, putting me in the 64th percentile. My chart says that if a race involves a substantial climb in the 5+ minute range, I will struggle to stay with the front riders. And guess what: that’s true!
Contrast my chart above with Team ODZ’s Justin Wagner:
First, you might notice his wattage numbers are just crazy strong (he’s a top A racer while I’m a non-top B). But you’ll also notice that his best power is in the 20-minute range (96th percentile!) which is why you’ll often see Justin winning races from long solo breaks (on Zwift and outdoors).
Justin and I are pretty big guys, though. Take a look at a lighter-weight rider who excels in sprint finishes: unofficial Zwift Poet Laureat and high-paid hairspray model Greg Leo:
Notice how, as a lightweight rider, Greg’s power-to-weight numbers are his biggest strength. This means pitchy racecourses suit him best. His massive 15s power means a bunch finish with an uphill sprint (perhaps in NYC’s Central Park?) is right in his wheelhouse, since he’s stronger there than 98% of the population.
Greg won’t do too bad on a flat sprint either, but he’s in the 80th percentile as a short sprinter, which means he’ll have a tougher time taking the win than on an uphill.
Using the Data: Training

I know I need to work on my 5-minute power. What about you?
If you’re looking for a resource to help you train, check out the brand-new 3rd edition of Training and Racing with a Power Meter. Excellent resource!
Conclusion
There’s much more we could discuss with these rider phenotype numbers, but I hope this gets you started. Questions or comments? Post below!


