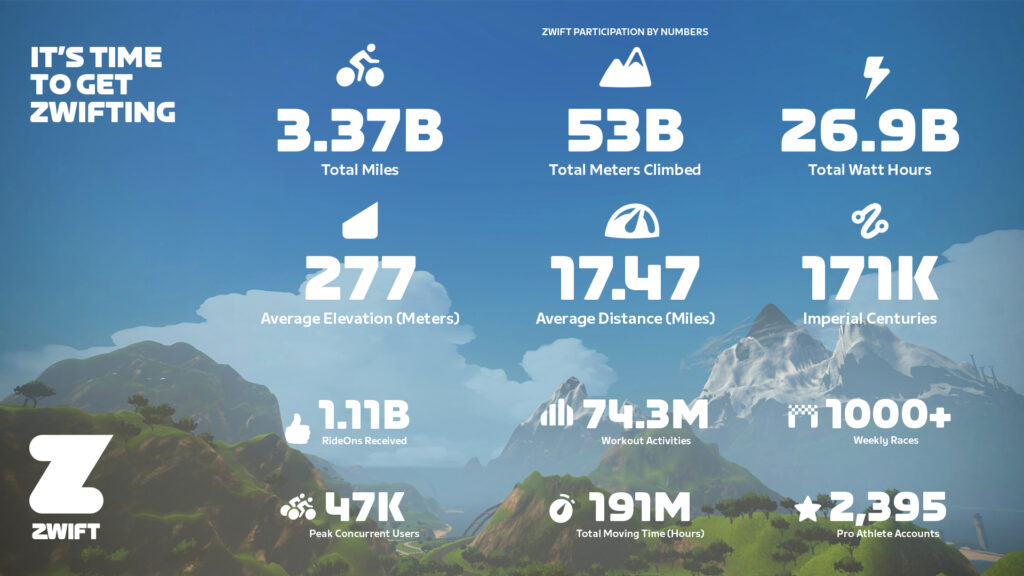
During their recent This Season on Zwift media event, Zwift shared the following slide summarizing Zwifter activity since the launch of the platform in September 2014:

Here’s the list of stats, with notes from me in italics:
- Total Miles: 3.37 billion
- Total Meters Climbed: 53 billion (that’s an average of 9.77 meters of climbing per km, which almost precisely matches NYC’s LaGuardia Loop or Makuri Islands’ Temples and Towers)
- Total Watt Hours: 26.9 billion (or 26.9 million kilowatt-hours. That’s enough to power New York City for approximately… 2.2 days. That’s 96.84 billion kilojoules, or 23.14 billion calories! That’s over 81 million pizza slices in Zwift math.)
- Average Elevation: 277m
- Average Distance: 17.47 miles
- Imperial Centuries: 171k
- Ride Ons Received: 1.11 billion (this means Zwifters have received 1 Ride On every 3 miles, on average)
- Workout Activities: 74.3 million
- Weekly Races: 1000+ (perhaps a bit high. Our numbers from ZwiftHacks show around 650 community races this week, plus 120 events for Zwift’s ZRacing series. This wouldn’t include private events such as WTRL’s Thursday TTTs, of course.)
- Peak Concurrent Users: 47k (we think it’s actually 49k)
- Total Moving Time: 191 million hours (that works out to an average speed of 17.6 miles per hour – not bad, considering running is included!)
- Pro Athlete Accounts: 2,395
Note: these stats all include running, except for “total watt hours”.
Your Thoughts
Share below!

