Author’s note: A stationary indoor bike will be accurate in Zwift with a power meter. This article is about comparing a “spin bike” (which is a trademarked term) with a power meter to the same bike with a simple speed/cadence sensor.
From time to time I see questions on using a stationary bike in Zwift. More often than not, the advice given is “grab a cadence and speed sensor and you are good to go”. The well-intentioned suggestion utilizes the option Zwift provides of using a speed and cadence sensor with a non-smart classic trainer.
Essentially Zwift has tested certain non-smart classic trainers and those supported trainers have a lookup table in Zwift. Basically. for X speed, you’re doing X watts. It’s a power curve table. For Unlisted/Untested trainers they have another lookup table, but probably based more on averages that may or may not be accurate. There’s a lot more to it, but I’ll invite you to read the excellent Zwift Insider post about virtual power vs going over it here again.
The Challenge with Stationary Bikes
Connecting a stationary bike as a trainer on Zwift can be a problem, though. Here’s why: a trainer has a set resistance (the pressure of the roller on the back wheel) and your speed increases with your wattage via gear changes and cadence, whereas a stationary bike has speed that is dependent only on cadence (no gears). You can change resistance manually with a knob, but if you maintain the same cadence, you will maintain the same speed and thus, the same Zwift estimated power, regardless of where the resistance knob is set.
To put that a different way, as long as you pedal at the same cadence on a stationary bike, your flywheel will spin at the same given speed. The way you increase the wattage on a stationary bike is by putting resistance on the flywheel, resulting in more wattage to keep the flywheel going at the same speed.
It’s worth mentioning here that resistance on a classic trainer can also be highly variable depending on how tight or loose the roller is against the tire. Classic trainers have to have the roller tightened against the wheel to the trainer’s spec in order to be anywhere near accurate in terms of wattage. So it can basically be as variable as a stationary bike would be, although you can’t just reach down and tweak it on the fly. Anyone who has experimented with that knows that the looser a wheel is against the roller, the higher the reported watts will be, and vice versa. Hence the reason proper tightening is so crucial.
Back to the stationary bike. When Zwift is estimating power solely by a speed and cadence sensor and knows nothing about the resistance knob, that estimated power number will be wrong. It will be wrong because it’s missing an enormous part of the equation, the resistance, something it knows for a trainer, but can not know on a stationary bike.
Spindown for Stationary Bikes
How could Zwift know resistance and have accurate zPower with a stationary bike? The only way I can theorize it working is to have a spindown test within Zwift. Set the stationary bike resistance to where you want to ride, do a spindown to determine resistance, then keep the resistance at that setting the entire ride, using only cadence to make changes in power.
Not a great way to ride, and Zwift would also need to know the stationary bike gear ratio (or use the speed which the stationary bike displays) for its calculations.
Testing Stationary Bike Power Accuracy
Enough explanation, let’s see it in practice. To illustrate why a stationary bike isn’t accurate in the Not Listed trainer setting, I set up a few testing scenarios. I set up a single Freemotion stationary bike with a Stages power meter and a Wahoo speed sensor. I then set up two Zwift sessions, with exactly the same height, weight, bike, wheels, gender, FTP, etc. I paired the speed sensor, HR sensor, and cadence sensor to one session via ANT+. I then paired the power meter, the same HR sensor and the same cadence sensor to the other session via Bluetooth. The same pedalling effort would go into both sessions, power would just be output via different sensors.
To put this into a visual format:
| Session 1 | Session 2 | |
| Name | Harry Legz | Scott DeLeeuw |
| Stationary bike | Freemotion s11.6 | Freemotion s11.6 |
| In-game bike | Zwift carbon w/ 32mm carbon wheels | Zwift carbon w/ 32mm carbon wheels |
| FTP | 197 | 197 |
| Gender | Male | Male |
| Height | 5’ 10” | 5’ 10” |
| Weight | 177 lbs. | 177 lbs. |
| Cadence input | Stages power meter | Stages power meter |
| Heart rate input | Scosche Rhythm+ | Scosche Rhythm+ |
| Power input | Wahoo speed sensor, “Not Listed” trainer, 20” wheel setting | Stages power meter |
| Connection format | ANT+ | Bluetooth |
Note: the FTP setting was lowered to see if either of the tests would result in an FTP gain that wasn’t warranted.
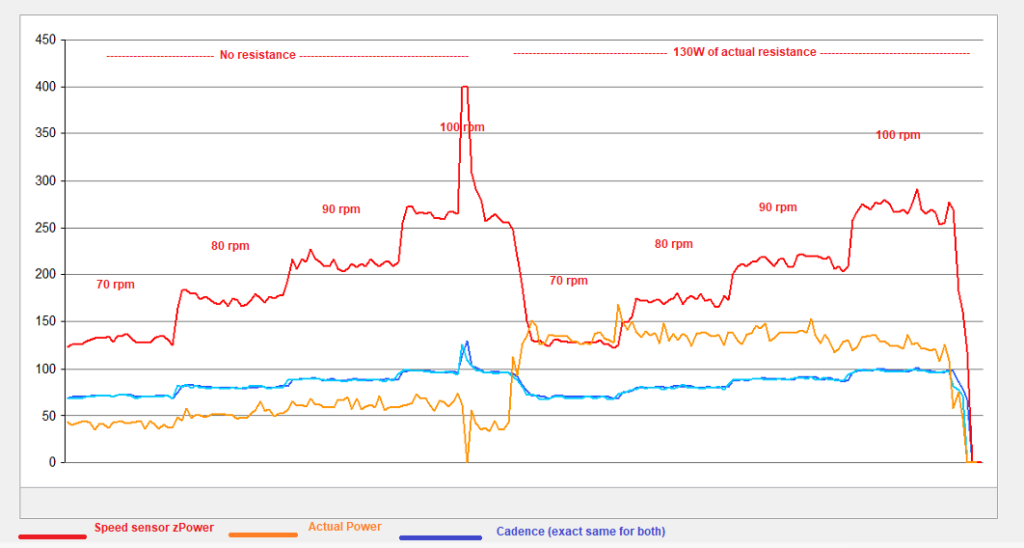
For the first test I set up a MeetUp on Watopia Flat between myself and my identical twin nemesis Harry Legz. I configured the MeetUp to include only the two of us so variables like drafting did not come into play. My first test was a cadence test. I would do 2 minutes with no resistance at all at 70 rpm, 80 rpm, 90rpm, and 100rpm. Then I would repeat these same 70, 80, 90, and 100 rpm tests, but with about 130W of resistance on the knob.
The graph below shows the comparison. Cadence was the same as they were coming from the same sensor:
| No resistance | No resistance | 130W(ish) actual power* | 130W(ish) actual power* | |
| Speed sensor zPower | Power meter | Speed sensor zPower | Power meter | |
| 70 rpm wattage | 130W | 41W | 128W | 134W |
| 80 rpm wattage | 174W | 51W | 170W | 136W |
| 90 rpm wattage | 209W | 61W | 213W | 135W |
| 100 rpm wattage | 276W | 54W | 270W | 124W |
*Note: I adjusted the resistance knob on each cadence change to maintain 130W(ish) via the power meter reading.
When I turned the stationary bike’s resistance knob to around 130W(ish) actual power, the results were pretty much exactly the same for the estimated power coming from the speed sensor as they were during the no resistance test. This is expected since the cadence was the same as the first part of the test, and if the cadence is the same, the speed will stay the same. The graph below shows the data comparison visually.
One interesting observation on the no resistance test: true wattage actually went down at 100 RPM. Since the watts are measured with a crank power meter, my take on that is the momentum of the flywheel started to take over, pulling the pedal through. I was pedaling faster, but softer.

As you can see, there is a very large discrepancy in actual power vs estimated power, over 200W at some points in the graph, but what did it do for the ride stats?
Watopia Flat Route, ride time 23 min 24 sec
| Speed sensor zPower | Power meter | |
| Distance | 5.48 miles | 4.03 miles |
| Avg Power | 195W | 75W |
| Max Power | 400W | 162W |
| Avg Speed | 20.1 mph | 14.8 mph |
| Max Speed | 30.5 mph | 23.8 mph |
For the very same pedaling effort, the speed sensor rider covered a mile and a half additional distance in just 23 minutes! That is almost 30% more!
Just for fun I also tested what would “MAX” out the 400W estimated power on the stationary bike. That happened around 115rpm. As long as I maintained 115 rpm, regardless of resistance, I would peg 400W in my Harry Legz session. (It’s worth noting that I could do 400 estimated zPower watts at around 50W of actual power, if the resistance was dialed down on the stationary bike.)
The cadence test is all fine and dandy, but I wanted to see what difference this made during an actual ride. Maybe one with an interval workout incorporated into it to see actual larger power hills and valleys and how they would track between both setups. Once again I set up a single Freemotion stationary bike with a Stages power meter and a Wahoo speed sensor, then rain two parallel Zwift sessions just like the first test.
For the actual ride I set up a one hour MeetUp on the 5.7 mile Watopia Hilly Route for the two sessions. I set the MeetUp to include only the two of us so variables like drafting did not come into play.
This was my ride format:
- 20 min warm-up
- 5 min at 190(ish) watts
- 5 min rest
- 5 min at 190(ish) watts
- 5 min rest
- 5 min at 190(ish) watts
- 5 min rest
- 10 min cooldown
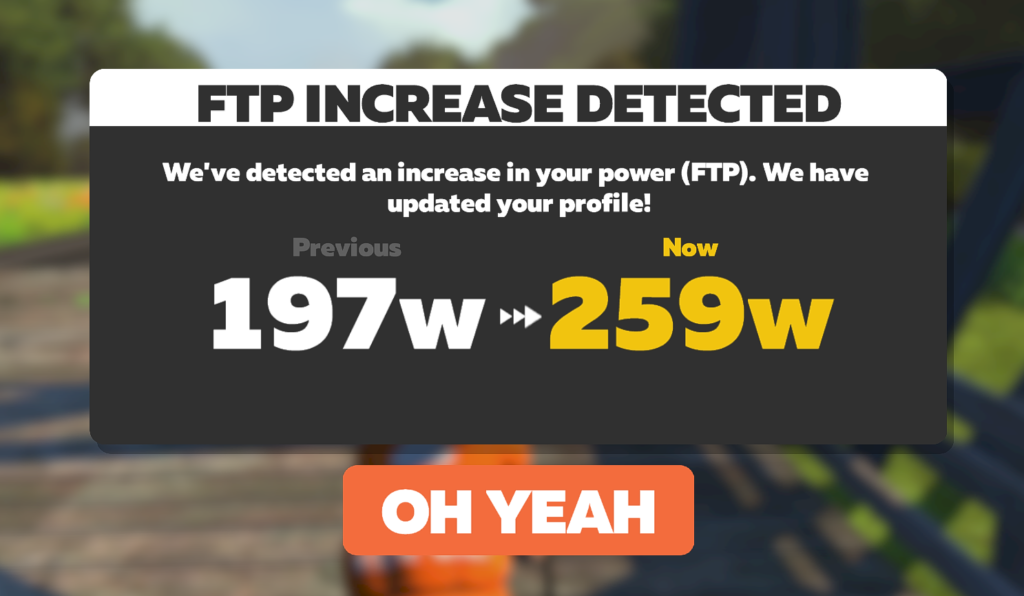
The result of this match-up? Remember this is input from one bike. My nemesis Harry Legz lapped me on Zwift KOM just as I was starting lap 3 of Hilly Route, rocketing past me at the finish banner. He also took second fastest time (I honestly felt bad about that) on Hilly Route. At the end of the ride/workout, he received a nice fat FTP gain, despite only about 15 minutes of a moderate 190W effort.

Let’s look at the data.
Watopia Hilly Route, ride time 1 hour
| Speed sensor zPower | Power meter | |
| Distance | 21.73 miles | 15.11 miles |
| Avg Power | 254W | 132W |
| Max Power | 400W | 264W |
| Avg Speed | 21.4 mph | 15.0 mph |
| Max Speed | 38.7 mph | 36.1 mph |
| KOM time during 110W 90rpm warmup | 3:29.16 | 6:52.69 |
| Villa sprint time during 110W 90rpm warmup | 34.22 sec | 44.76 sec |
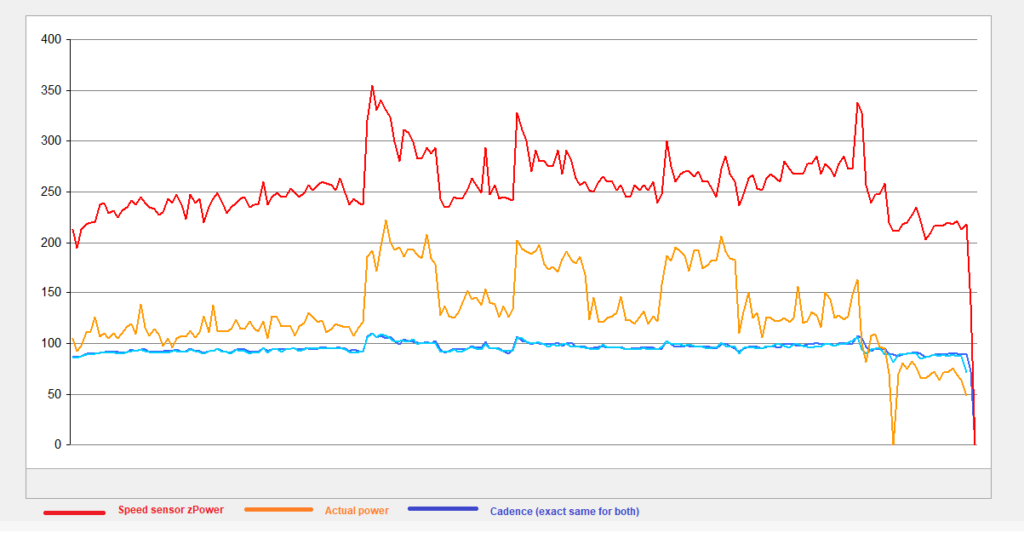
While these numbers look dramatic, the graph of the power difference looks even more dramatic:

This graph does look more interesting at first glance than I thought it would. zPower is about 100-200W high as before, but the power curves parallel each other more than I first expected until I really analyzed the data. Why is that? If you notice the cadence line I was soft pedaling at around 90 or so rpm for the warmup, rest intervals and cooldown. During the intervals themselves my cadence would go higher to 100-105 rpm. Since zPower is being estimated by speed, which is directly related to cadence on a fixed gear stationary bike, this makes perfect sense. A jump in 10rpm made a massive difference in zPower because it was making a big jump in flywheel speed. It was simply a coincidence that my higher true power was done at a higher cadence and that higher cadence gave a higher zPower number.
Searching for Sweet Spot
Discerning Zwifters may wonder if there’s a “sweet spot” on the stationary bike’s resistance knob where zPower and true power converge across a usable cadence range (say, 70-100RPM). Or to put it simply: can we make the zPower number be close to accurate on a stationary bike?
The answer is: not really. Not without actively varying the resistance knob, and having a power meter to check your accuracy. (Of course, if you have a power meter, you don’t need a speed or cadence sensor or zPower anyway.)
On my first cadence test when I had 130W of resistance on the flywheel and was pedaling at 70rpm, the numbers were nearly identical. On the second test, if I had maintained about 85rpm in my 190W intervals power would have tracked closely. I could have also cranked up the resistance to 400w and spun at 115rpm (for the whole minute I could maintain that). But without a power meter I would have been guessing that the numbers lined up and inevitably what would happen is you’d loosen the resistance knob and drop actual power, but zPower would stay at 400W since your cadence isn’t changing.
Conclusions
So there you have it. I had fun doing this test. It might seem pointless, but I wanted some real world data for when the suggestion is thrown out to just use a speed and cadence sensor with the Not Listed trainer setting on a stationary bike. Seeing this data I don’t think it’s a good idea. I get that it’s inexpensive and not everyone has the money for a power meter, but you are missing the resistance part of the estimated zPower equation. Because of that, the power estimates are at best a guess, and a bad one at that.
None of this is to say a stationary bike is a bad idea for Zwift, a stationary bike can be a GREAT tool for Zwift. If you have multiple riders in the family, or just want the simplicity of hopping on and riding, a stationary bike may just be the ticket. But please reconsider the incorrect speed and cadence route and set it up with a power meter such as a Stages crank or power pedals like the Assioma UNOs. There are inexpensive options if you look around.
I agree with the purists when they say a stationary bike won’t get resistance changes from Zwift, but Zwift will use the power you are putting into the bike to adjust your speed up and down in the game, the same as if you were riding a bike outside that dynamically adjusted gears to keep your cadence the same as you hit uphills and downhills. Stationary bike or smart trainer, the true power you put into your pedals is what determines your speed in the game, the gradient feel is icing on the cake.
I wrote another article about an inexpensive stationary bike setup that will work with Zwift that can save some cash over the long haul. I found my entire stationary bike, with power meter, for $200. If you are thinking about going that route, it’s worth taking a look.
Cadence and speed sensors on a stationary bike – summary
Pros:
- Inexpensive
- Can do rides and give Ride Ons
- Breaks up the monotony of indoor training
- Could be a gateway to a great Zwift future
Cons:
- Not what Zwift intended with the speed and cadence option
- Isn’t accurate, missing the resistance part of the equation
- Not useful for personal fitness improvement measurements since zPower is only tied to cadence/speed, not how many watts you are actually producing
- Can not do training plans as power targets are only tied to cadence/speed, not resistance
- Will be very disheartening if you ever go to a power meter or smart trainer
Questions or Comments?
Share below!
