Put simply: when Zwift started, it was not designed as a competitive system. It was designed to make riding indoors fun, and that it does.
But ever since the dawn of Zwift, people have raced on Zwift. And there has been one consistent challenge: can we have racing that is fair and fun please?
To split races into categories for a more engaging/competitive experience, a categorisation system emerged: A, B, C, and D, (effectively) set by the rider’s maximum 20-minute w/kg power. This was a very good start, but an ideal next step would be a ranking system which ranks each rider, say between 0 and 1000 with 10% of riders in each 100. In this article and the next, a reasonable way of doing that will be explored. Let’s dive in!
The Data
From data that is now easily available online through ZwiftPower, it is possible to see which of 8 possible power rankings most correlates to race results. Those eight measures are: 15-second power, 1-minute power, 5-minute power, and 20-minute power, each measured both in watts and in watts per kilogram (wkg).
Furthermore, a wonderful team of DIRT riders recently put on the Dirt Racing Series. This provided a series of races by the same group of riders. Using the rider power data and the race results allows us to look at how a rider’s power metric links to their race placing:
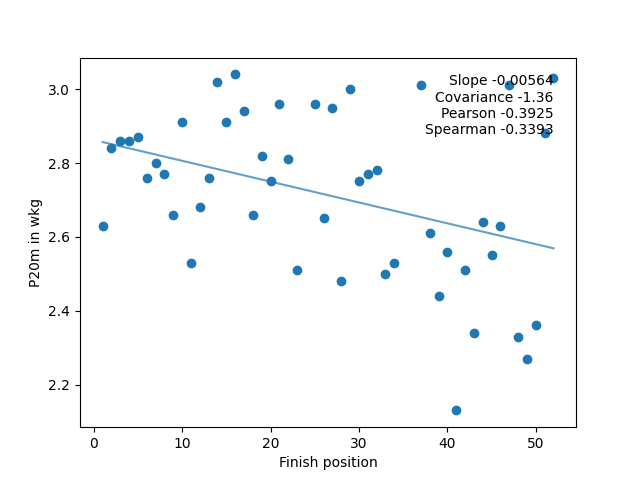

The left chart shows the 20-minute power (in w/kg) of the riders by place in the race for the lowest category (combined C and D) on the crit-style race in the series. On the right, 1-minute power (in watts) of the riders by place in the same race. The graphs are a bit skewed by the different scales on the left, which make comparison hard. To make things clearer, the data can be scaled so that the highest power in the set is scaled to 1, and the other power values are scaled accordingly. The data then looks like this:

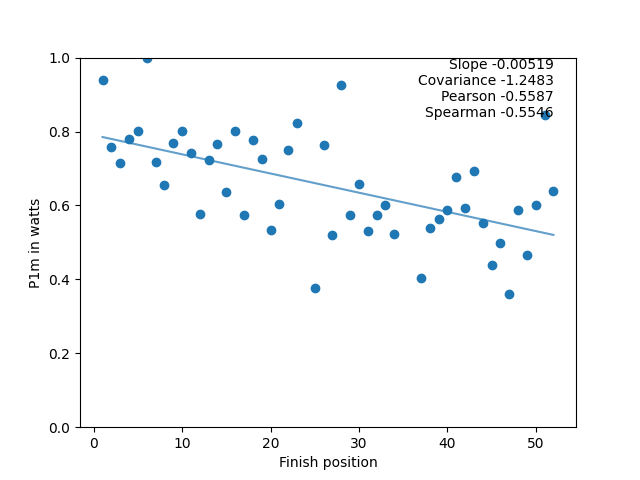
Clearly, the second one (1-minute power in watts) influenced the outcome more than the first one (20-minute power in w/kg).
The Analysis
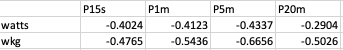
There are a number of ways to work out the correlation between data (in this case, each of the 8 power measures), and a result (in this case, race rank). In this analysis, three ways were picked for comparison: The slope of the best line fit, the Pearson coefficient, and the Spearman coefficient. On the graphs above you can see these for the data (as well as the covariance, which was there for sanity checking the results).
They are negative (as expected) because the line goes downwards, (ie the less power, the higher (in number) the finish position). The bigger (ie more negative) the measures are, the more that that input (rider’s power data) is linked to the output (their finishing position in the race).
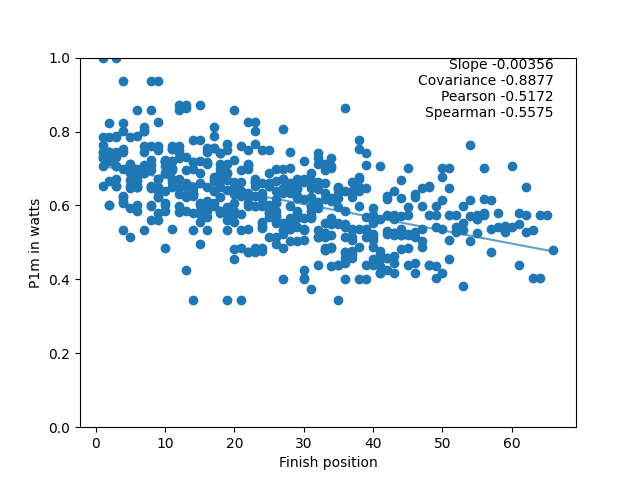
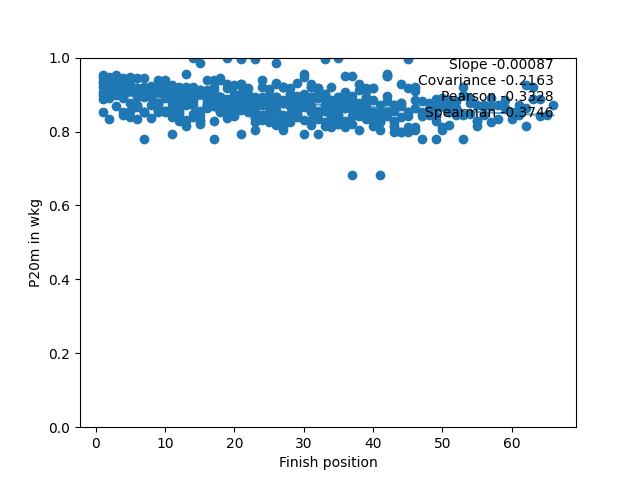
One race is interesting, but much more can be learned from combing information from lots of races. As an example, using the “B” group in this race series, all of the race results can be combined to get a set of graphs. Here they are for 1-minute power in watts and the 20-minute power in w/kg (with normalisation of the power applied so make the scales are comparable) combining all the information from all of the B group races (except the Team Time Trial, see postscript 1):
For each data collection, there are three possible values (slope, Pearson, and Spearman) for each of the eight measures. To simplify things, the actual values can be turned into a “percentage contribution”. For the Pearson coefficient for all of the C+ category races, here’s what that means:
Becomes:
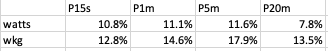
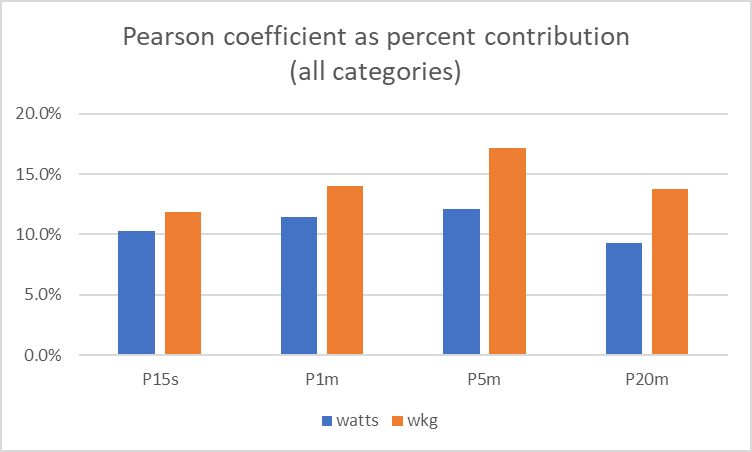
And this means we now have an idea of the “percentage contribution” that a particular power measure makes to the rider’s result. Those percentages can then be averaged across all of the power categories. Pearson, again, now for all races, all race categories:
To balance out differences between the three measures (Pearson, slope, and Spearman), they can be averaged, which gives:

This now gives an idea of the influence of each power measure on the race outcome. In conclusion: Every power measure is linked to the outcome, but some more than others. Not surprisingly, 20-minute power in watts is the least influential, whilst 5 and 1-minute power in w/kg (accelerations and short climbs) are the most influential.
So that’s the analysis. The next article will explore how to use this information to create a clear way of ranking riders that should give good categories which can be determined easily by race organisers to suit the riders they expect in the race.
Postscript: A Couple of Questions You Might Ask
The categories which riders signed up for in the races used to create the charts above were set using 20-minute w/kg power, meaning that there is less scope for variation in that power than the others. This means that this analysis might be biased against its influence. Indeed, it does have a bit more influence in the top and bottom categories (A/A+ and combined C/D) than the middle ones, which agrees with this concern. However, it is not very significant, and the combining of all the categories together will come close to resolving that.
Secondly: what about different types of racing? This analysis combines different types of racing (an individual time trial, two general races, and a crit). It doesn’t include the TTT data as no simple way was found to link those team results to each individual’s performance that is consistent with the rest of the analysis. However, examining the race data by race type shows what we would expect given everything else so far: the iTT races are more influenced by the longer power measures (5 and 20-minute), crit racing by the shorter ones (15s and 1-minute), but not to the exclusion of the others. Overall, the data from these races suggests that, for an overall “racer assessment”, the ratios given above remain sensible, although there is one nuance that will be addressed in the next article.
Postscript 2: Data Sources
The power data used in this analysis is available to any Zwift rider who connects with Zwift Power; it has been anonymised in the processing as can be seen. The race data is from the Dirt Racing Series (who have explicitly given permission for anonymised data use for this analysis).
Questions or Comments?
Share below!
