

A few months ago, I wrote about the ZwiftPower ZRS Browser Extension. Since then, it has undergone substantial upgrades, including an incredibly detailed new profile page that charts your ZRS history! So I reached out to the creator (who goes by the pseudonym “int” on socials) for a look at what has changed, including a detailed list of new features. Here’s what I received…
From the Creator
Since the last Zwift Insider article, the extension has grown quite a bit.
The very first version took only a few hours to build. I probably spent almost the same amount of time writing my response to Zwift Insider when he first reached out. It was just a simple script to inject ZRS scores into ZwiftPower event pages. Nothing fancy.
Back then, I mentioned the article may “give the project new life.” Well, it did. The article brought in more users, and with them came requests. Profile page support. History graphs. More detailed analytics. Each feature request led to another and the codebase went from a few hundred lines to… well, something more substantial.
So here we are again, writing another response after Eric reached out asking if I had any “juicy details” to share.
Recent Development
The active users of the extension already know that not everything went smoothly.
The first major update went live and didn’t last long. Users started processing their lifetime event histories, and some corrupt Zwift events from years ago triggered an infinite fetching loop.
The combination—hundreds of users processing thousands of events each, plus the bug causing endless retries—created an API spike. I fixed the bug immediately after it was reported, but the damage was already done. Zwift decided to enforce authentication requirements, breaking the extension for everyone.
I reached out to Zwift, acknowledged I should have coordinated beforehand, and didn’t hear back. So a few days later I implemented a workaround that captures the user’s Zwift token (with the user’s permission, of course) to get things going again.
Besides restoring functionality, authentication unlocked additional API endpoints that made most of the newly added features possible. In the end, the authentication enforcement turned out to be a good thing.
Looking Forward
The extension serves a niche within the Zwift community, and I’m glad people find it useful. There’s still plenty to improve—I won’t be running out of ideas anytime soon. I appreciate everyone who’s taken the time to report bugs, suggest features, or simply tell your buddy about it. And special thanks to the testers.
Hopefully, Eric will have a reason to check in again down the road.
If you have thoughts or ideas, feel free to reach out.
(That goes for Zwift, too. It would be cool if we could implement proper OAuth2 authentication and you could relax your CORS restrictions a little bit.)
ZRS Extension: Technical Overview
What ZRS Extension Does
The ZRS extension enhances ZwiftPower.com by adding ZRS (Zwift Racing Score) data, performance analytics, and racing statistics to profile and event pages. The extension operates as a fully decentralized system, running entirely within the browser environment. All data processing, storage, and analytics occur locally on the user’s device, with no external servers or databases involved.
Key Capabilities
- ZRS Score Integration: Adds ZRS scores and changes directly into ZwiftPower event tables
- Performance Analytics: Power analysis, phenotype detection, activity tracking
- Racing Statistics: Head-to-head comparisons, ranking points visualization, ZRS history graphs
The Profile Dashboard
Layout Overview
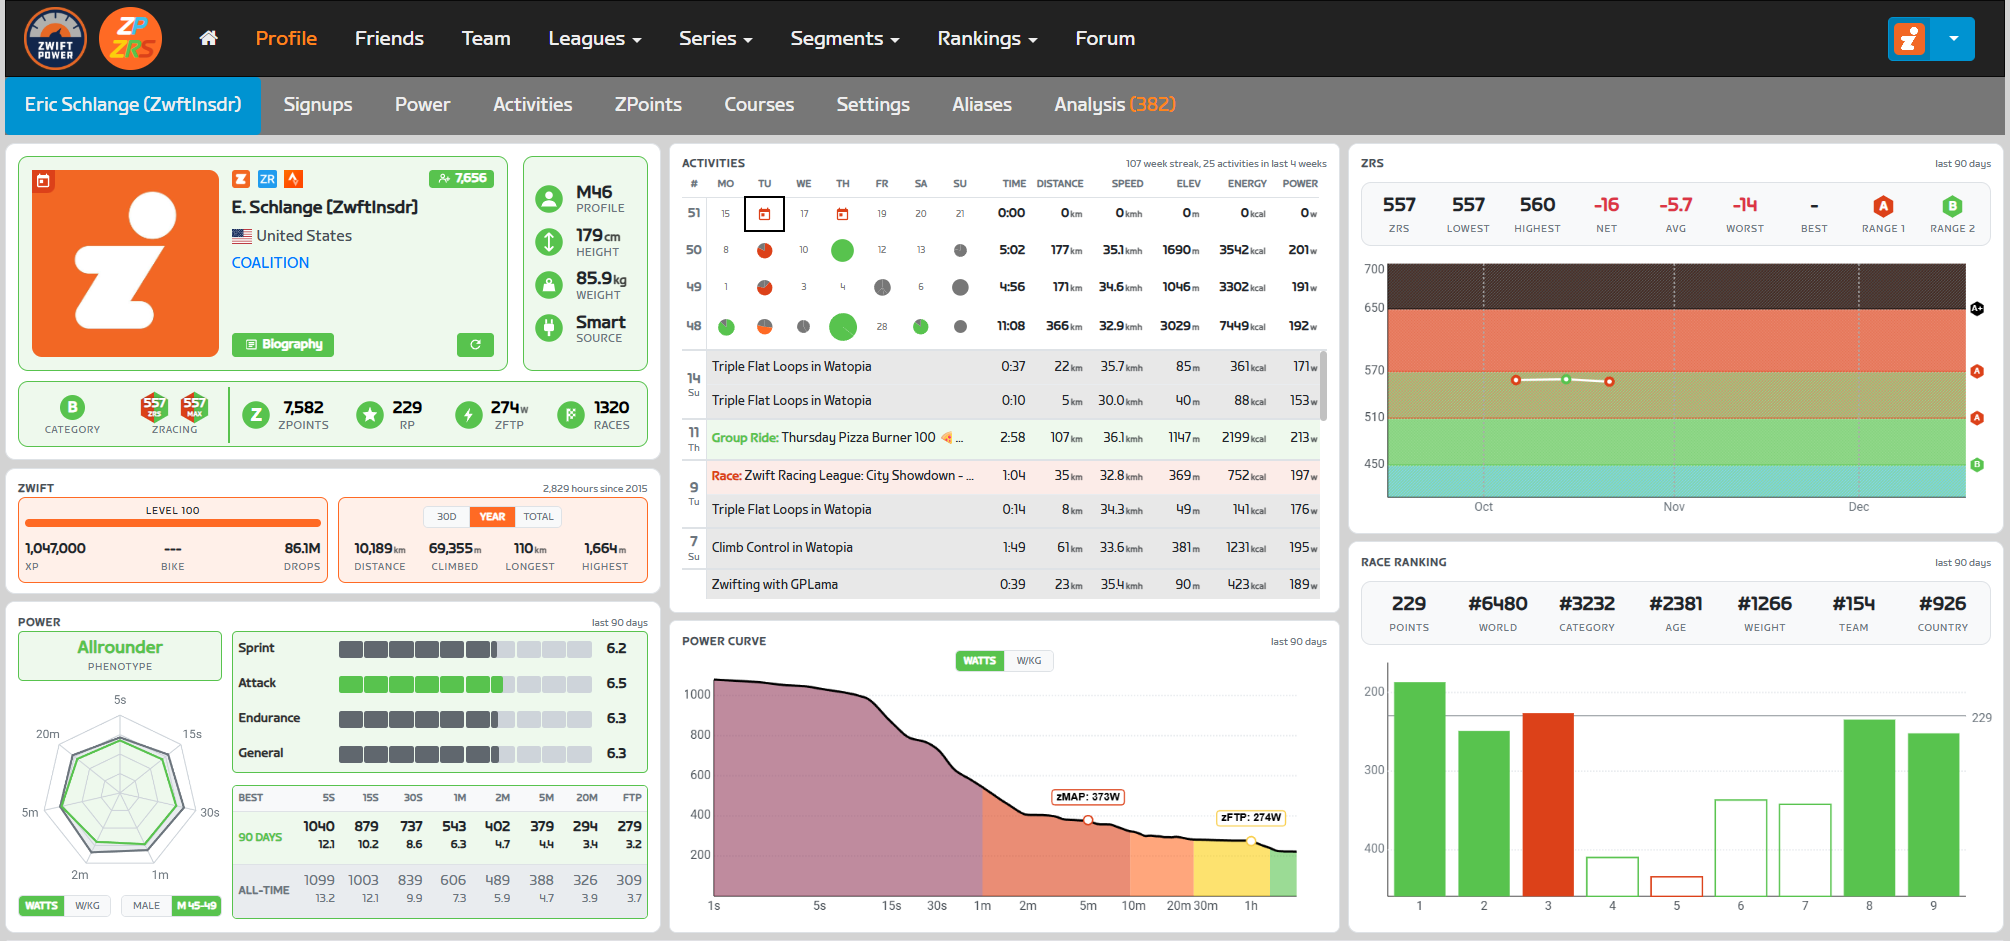
The extension redesigns the ZwiftPower profile page with a three-column dashboard layout:
- Left Column: Athlete profile, Zwift stats, and power analysis
- Middle Column: Activities, and context-aware panels (power curve for personal profiles, head-to-head for opponents)
- Right Column: ZRS score history and race ranking points
Left Column: Athlete Profile & Performance
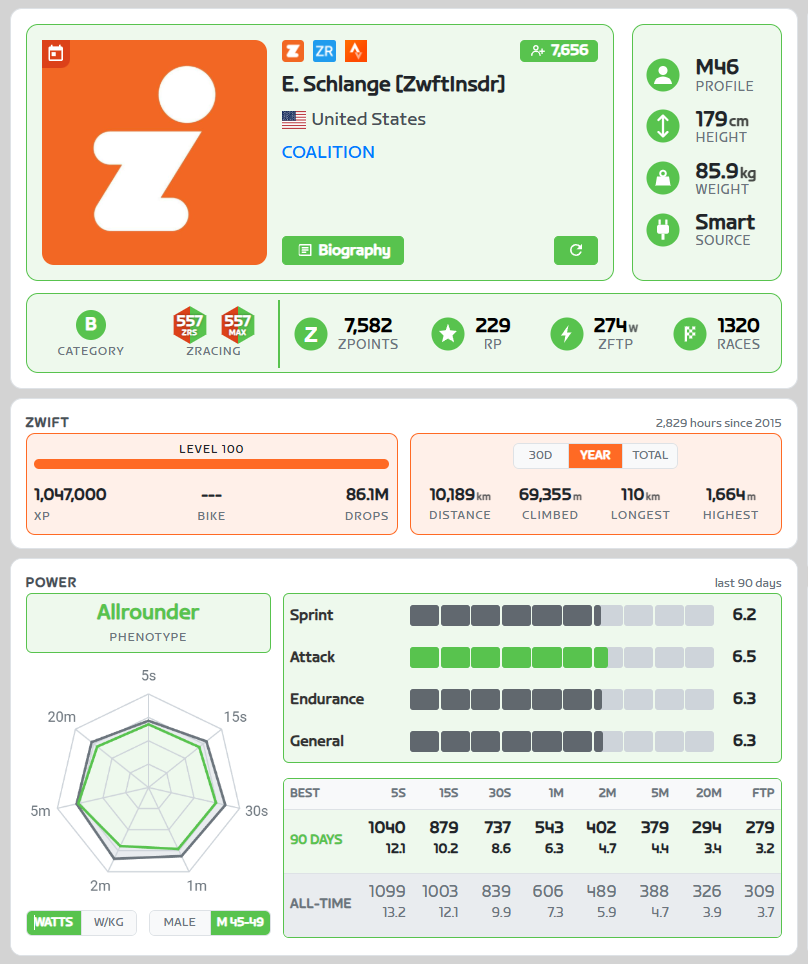
Main Profile Panel
Identity Section:
- Profile picture (or ZRS logo placeholder if no picture)
- Zwift in-game name
- Country flag and name (or “Zwifterland” fallback)
- Team name (clickable link if available)
- Platform links: Zwift.com, ZwiftRacing.app, Strava.com
- Follower count button (links to Zwift follower page)
- Bio button (displays rider biography in modal)
- Refresh button (navigates to ZwiftPower profile update page)
Overlays (on profile picture):
- Online indicator (if currently riding)
- Signup indicator (if upcoming registered events exist)
Athlete Stats Section:
- Profile: Gender and age (e.g., “M45”, “F33”)
- Height (cm) with variation tooltip
- Weight (kg) with variation tooltip
- Power source (Smart Trainer, Power Meter, zPower)
Racing Stats Panel:
- Category: Shows racing category with color-coded circle (Mixed and Women’s categories for female riders)
- ZRS: Current racing score (dual badge showing both current and MAX30 score for personal profiles)
- ZPoints and Ranking Points (metrics from ZwiftPower)
- zFTP: Functional threshold power in watts and W/kg
- Race count with win and podium rate in tooltip
All sections use category-based color theming (A+ = black, A = red, B = green, etc.).
Zwift Stats Panel
Progression Subpanel:
- Level with progress bar showing percentage to next level
- XP (experience points)
- Current bike frame model
- Drops
Riding Stats Subpanel (toggleable between 30d/Year/Total):
- Distance (km)
- Elevation climbed (m)
- Longest ride (km)
- Highest climb (m)
Header: Shows total hours and “since [year]” (year joined Zwift)
Power Panel
Power Radar Chart:
- Spider web visualization for 7 durations (5s, 15s, 30s, 1min, 2min, 5min, 20min)
- Shows both 90-day recent bests and all-time bests
- Overlays intervals.icu distribution data (toggle between gender or gender-age data)
- Interactive hover tooltips for exact values
- Toggle between watts and W/kg display modes
Duration Power Table:
- Numerical values for all durations plus FTP
Power Skills:
Three skill categories rated 0.0-10.0 based on percentile vs. intervals.icu distribution data:
- Sprint (5s, 15s, 30s)
- Attack (1min, 2min, 5min)
- Endurance (20min)
- General average score
Phenotype Detection:
Analyzes power distribution to classify rider into one of six types:
- Sprinter: Explosive short-duration power specialist (example: Mark Cavendish)
- Puncheur: 1-5 minute effort specialist (example: Mathieu van der Poel)
- Time Trialist: High sustained raw watts (example: Stefan Küng)
- Climber: High sustained W/kg (example: Nairo Quintana)
- Allrounder: Balanced across all durations (example: Tadej Pogačar)
- Pursuiter: High sprint and endurance, weak middle durations (example: Dan Bigham)
Middle Column: Context-Aware Analytics
The middle column displays different panels depending on whether viewing your own profile or an opponent’s profile.

Activity Panel
4-Week Calendar Grid:
- Last 28 days displayed as 4 weeks × 7 days
- Activity type icons color-coded by type (race, TT, group workout, group ride, etc.)
- Signup indicator (calendar icon) for upcoming registered events
- Weekly totals column
Scrollable Activity List:
- Chronological list of recent activities
- Background colors match activity type
- Clickable rows link to detailed activity page on zwift.com
1v1 Head-to-Head Panel (Opponent Profile)
Summary Metrics:
- Total shared events (same category races)
- Win/loss record
- Win rate percentage
- Average position advantage/disadvantage (% of field size)
Match History List:
- Scrollable list of all shared events
- Each row shows: event name, category circle, zwift ingame name, date
- Win/loss indicator (green/red)
- Clickable to view full event results
This feature requires complete lifetime event processing for the user’s own profile. First-time processing may require a few minutes depending on race history volume.
Power Curve Panel (Personal Profile Only)
Power Curve Graph:
- Line chart of best power outputs across all durations
- X-axis: Duration (logarithmic scale, 5s to 60min)
- Y-axis: Power (toggle between watts and W/kg)
- Shows only 90-day best (all-time data from Zwift API is unreliable)
Power Zone Background:
Shaded regions showing Zwift’s 7 power zones based on FTP percentage:
- Z1 Recovery (<60% FTP) – Gray
- Z2 Endurance (60-75%) – Cyan
- Z3 Tempo (75-89%) – Green
- Z4 Threshold (89-104%) – Yellow
- Z5 VO2 Max (104-118%) – Orange
- Z6 Anaerobic (118-200%) – Red
- Z7 Sprint (>200%) – Magenta
Interactive hover shows exact values at specific durations.
Right Column: Racing Performance
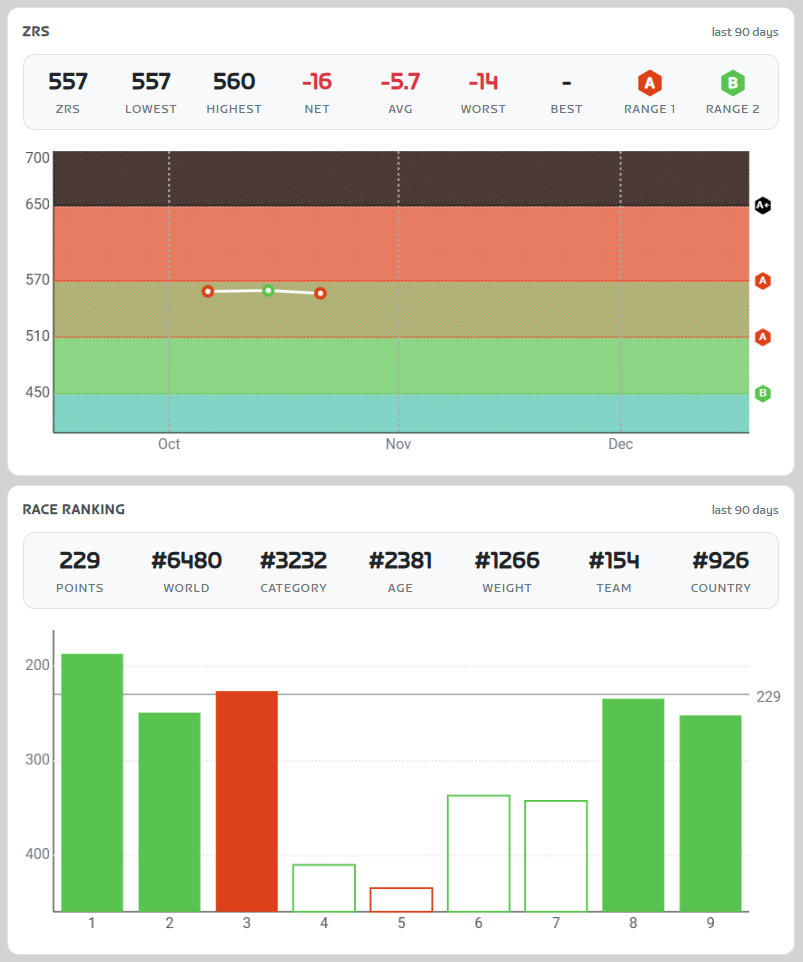
ZRS Graph Panel
Dashboard Metrics (7 cells):
- Current ZRS score
- Lowest score in last 90 days
- Highest score in last 90 days
- Net change (total gains/losses)
- Average change per event
- Worst single event loss
- Best single event gain
- Eligible race categories (hexagon badges, clickable to show upcoming events in that category)
Score History Graph:
- Time-series line chart showing ZRS progression (last 90 days)
- X-axis: Time with month labels
- Y-axis: ZRS score (0-1000)
- Background diagonal stripe patterns show category boundaries:
- Range 1: E (0-159), D (160-269), C (270-389), B (390-509), A (510-649)
- Range 2: E (0-209), D (210-329), C (330-449), B (450-569), A (570-724)
- Advanced: A+ (650-1000)
- Data points colored by category of event
- Trophy icons displayed to highlight podium finishes
- Hover tooltips show event name, date, score change, rank, field size
- Smooth connecting lines show trajectory
Race Ranking Panel
Ranking Points Bar Chart:
- X-axis: Chronological event sequence (oldest to newest)
- Y-axis: Ranking points earned (0-100)
- Each bar represents one ranked event
- Bar height = points earned
- Bar color = event category
- Top 5 events highlighted with filled background (these count toward ranking)
- Hover tooltips: event name, category, exact points, rider’s position
ZwiftPowers’s ranking system uses top 5 events from last 90 days. This visualization shows which races currently contribute to the ranking score.
Event Pages & Table Enhancements
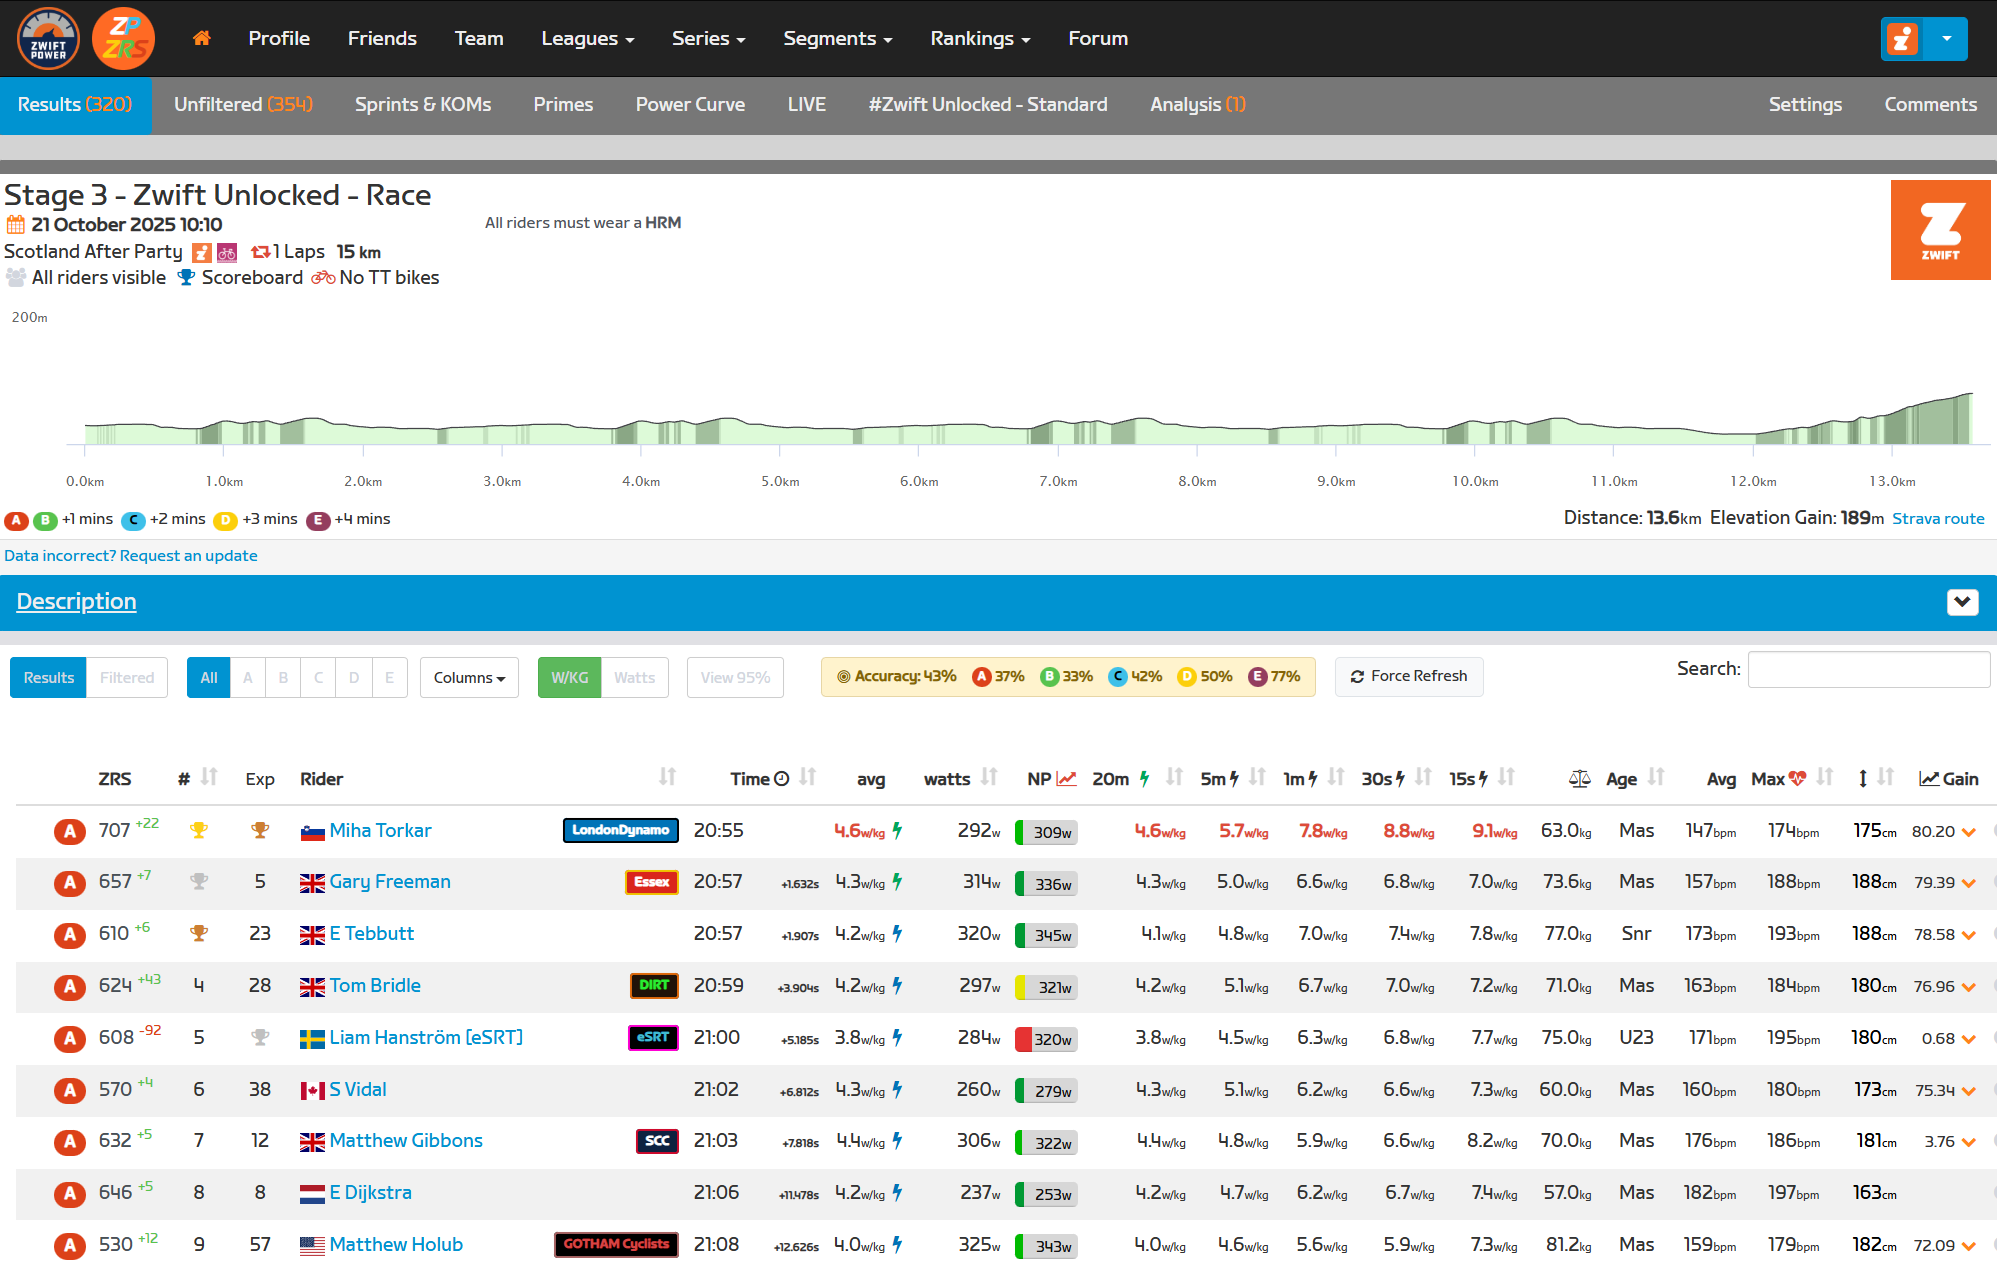
ZwiftPower Table Enhancement
New ZRS Columns
- “ZRS” column displaying current score
- “±” column showing score change from the event
- Score change type indicators (floor increased, at floor)
ZRS Prediction Accuracy

The extension calculates how accurately ZRS scores predicted the actual race results using Spearman’s rank correlation coefficient (ρ):
- Compares predicted finishing order (based on pre-race ZRS scores) vs. actual results
- Calculated per category, then weighted by field size for overall accuracy
- Displayed as percentage: +100% = perfect prediction, 0% = random, -100% = inverse
- Color-coded indicator: green (≥60%), yellow (30-59%), red (<30%)
This metric provides insight into whether the race results aligned with pre-race ZRS expectations (an objective way of determining how well ZRS is actually working).
Non-ZRS Event Detection
Events where no ZRS changes occurred (workouts, group rides, etc.) are identified and labeled with a “Non-ZRS Event” indicator, preventing confusion when no scores appear.
Under the Hood: Data Sources & Integration
The extension aggregates data from multiple sources to provide comprehensive racing analytics:
ZwiftPower
Profile and event metadata is extracted from ZwiftPower.com through two complementary methods:
Scraping: The extension reads visible event tables directly from the rendered page HTML to extract:
- Event IDs and dates
- Race categories and results
- Rider rankings and positions
- Event names and metadata
Interception: When ZwiftPower loads profile data via API calls, the extension intercepts these requests to capture:
- Complete event history
- ZwiftPower-specific metadata (race types, categories)
- Signup information
- Event results
Zwift Official API
ZRS scores and detailed race results come directly from Zwift’s official API.
Race Results Endpoint:
- ZRS scores (current and change)
- Score change types (floor increased, etc.)
- Subgroup assignments
- Field sizes and rankings
Profile Endpoint:
- Rider name and basic info
- Weight, height, FTP
- Country and platform data
Activities Endpoint:
- Recent ride history
- Activity types (races, group rides, workouts)
- Performance metrics
Max30 Endpoint: (personal profile only)
- Only accessible for the authenticated user’s own profile
Power Curve Endpoint:
- Complete power profile data across all durations
- Recent best efforts (5s, 15s, 30s, 1min, 2min, 5min, 10min, 20min, 60min, etc.)
- Only accessible for the authenticated user’s own profile
Intervals.icu Power Data
Benchmark power data embedded directly in the extension from Intervals.icu’s analysis of thousands of real cyclist power files:
Coverage: Age/gender-specific percentile data for:
- Multiple age brackets (Under 23, 30-34, 40+, 50+, 60+, etc.)
- Male and female categories
- Seven key durations (5s, 15s, 30s, 1min, 2min, 5min, 20min)
Questions or Comments
Share your thoughts below!

How can you get that update on zwiftpower or does it come automatically ? Thx in advance
See “Installation” on the original post I wrote about the ZRS Extension: https://zwiftinsider.com/zwiftpower-zrs/
It should refresh automatically any time you refresh the browser tab.
You can force it to refresh by hitting the refresh button that is in the bottom right of the main profile box, directly to the right of the “Biography” button.
Cheers
What to do, if this shows up?
…. well cant post the picture? It says this in the top right corner of the site:
“A new authentication token is required!
If you’re not logged in to Zwift, please check the background tab and log in”
What to do?
Visiting https://www.zwift.com/ and signing into your account should do it…
🙏 Thanks!
So why do I have a “ZRS Extension is temporarily disabled. Zwift now requires authentication for their API, which prevents the extension from fetching ZRS data. GG.” message on my Zwift Power page? I do not see any way to get what you are describing.
I do not have the “ZRS” above the rider category as you show.
Why do I have this message and not the info you show? I’d like to see it.
zwiftscoring dot app
one of the best features is the “power source” feature…finally you can find those all race winning guys who ride on Powermeters which are probably sloped (KK) and/or zPower (Jeanroch)…wohooo
Not sure why but using the Firefox extension my Racing Performance data wouldn’t load, it remained at 0. Switching to MS Edge it started loading immediately. I have had payment pages refuse to work correctly in the past whereas Edge works OK.
At 71 I love to delve into my own data just for fun, hence why I subscribe to intervals.icu too.
The power source isn’t always accurate. I ride on a Kickr Bike, however when I run on Zwift using my smart treadmill it changes my power source from Smart to ZPower.. at first I couldn’t figure out why it was showing me as ZPower but it seems to coincide with my Duathlon days where my last event was the run..
Love the extension and all the data and analytics. Only gripe is that something’s off with the power source info in the Athlete stats panel (at least for my profile). It has my power source as zPower, even though I have literally never ridden on Zwift with anything other than a direct drive smart trainer, and have been on a Kickr V6 for all my rides since installing the extension. All the files themselves have actual power (rather than estimate), so not sure what’s going on there.
There is a new update with a Sticky watts detector…maybe this page needs an update 🙂
Yes!
And it detects quite good riders with sticky watt.
I like the extension, but do have one question. I’ve noticed on some profiles and in the riders list, some riders have the Youtube logo for a link to their channel. I have my channel in my bio, but don’t see it on the profile page or in the rider lists for an event. Where is this pulling that link from to place it in ZP? I’d like to know so I can get mine set up.