

Recently while riding around Watopia, I noticed another rider named “Max (ZwiftCharts.com)”. Always curious about new zwifty websites, I pulled up zwiftcharts.com and discovered yet another useful Zwift community project.
What is ZwiftCharts? It’s a browser extension that interacts with ZwiftPower.com to provide post-event demographic and performance charts. It also interacts with WhatsOnZwift.com, but to a lesser degree.
While it’s been around for at least a few years, I hadn’t heard of it until recently, so I’m guessing many of you haven’t either. Let’s change that!
Installing the ZwiftCharts Extension
To install ZwiftCharts, pull up the extension homepage and click “Add to Chrome”. (You can also install the extension on Microsoft Edge.) Done!
Using ZwiftCharts on ZwiftPower
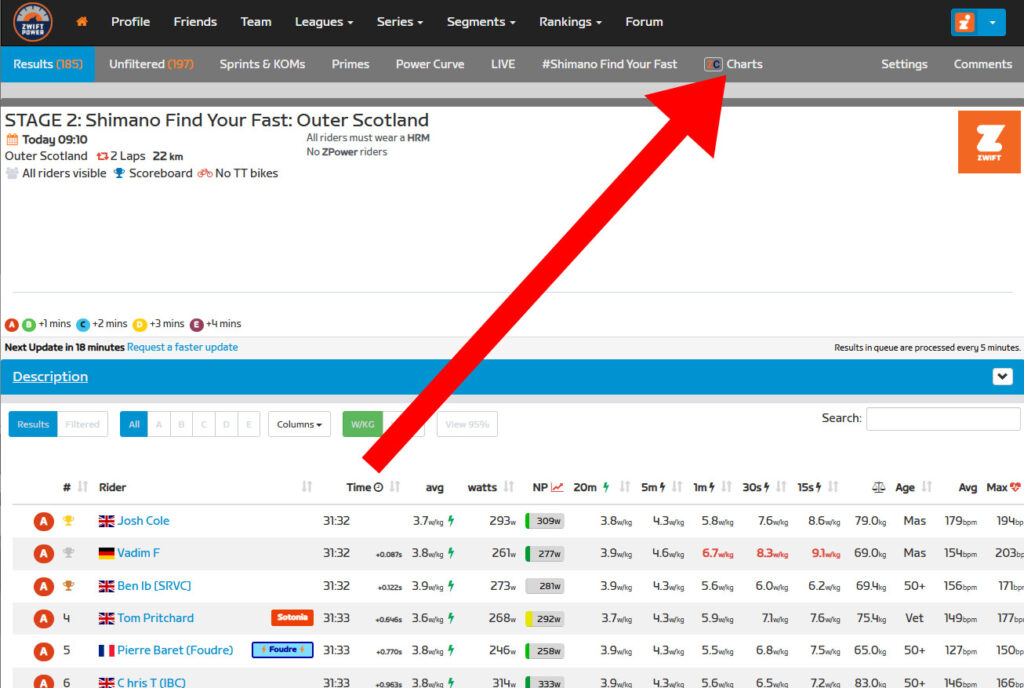
The extension simply pulls from the data already available in ZwiftPower’s event results, but displays it in useful charts. Accessing these charts is easy. Just log into ZwiftPower.com and click to view the results of a completed event. At the top of the results sheet you’ll see the ZwiftCharts button (shown below). Click that button to see all of the extension’s charts.
Related: How to Sign Up for ZwiftPower (and Why Every Zwifter Should Do It)
Here’s what is shown by default:
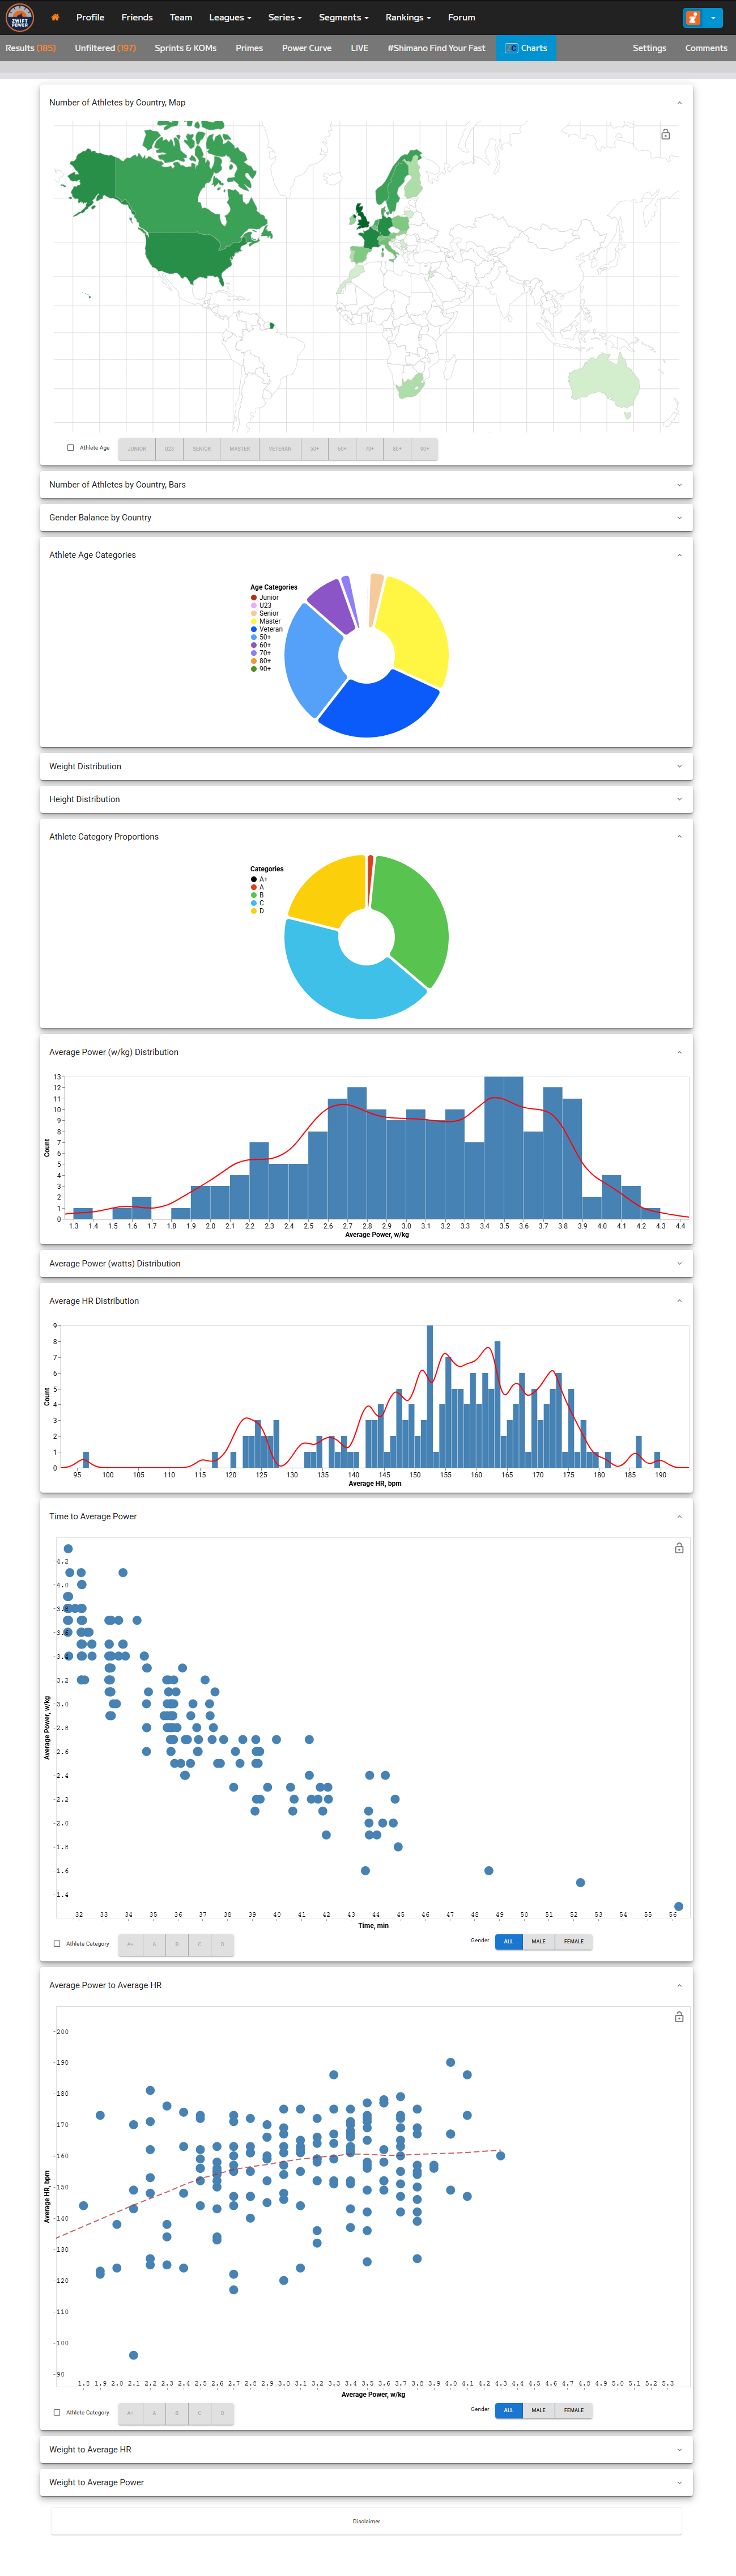
The complete list of available charts includes:
- Number of Athletes by Country, Map
- Number of Athletes by Country, Bars
- Gender Balance by Country
- Athlete Age Categories
- Weight Distribution
- Height Distribution
- Athlete Category Proportions
- Average Power (w/kg) Distribution
- Average Power (watts) Distribution
- Average HR Distribution
- Time to Average Power
- Average Power to HR
- Weight to Average HR
- Weight to Average Power
Using ZwiftCharts on WhatsOnZwift
ZwiftCharts also interacts with WhatsOnZwift to add data and interactivity to their workout charts. Simply pull up an individual workout on WhatsOnZwift, enter your FTP if needed, then click the ZwiftCharts button. You’ll see something like below, pulled from WhatsOnZwift’s “The Wringer” page:
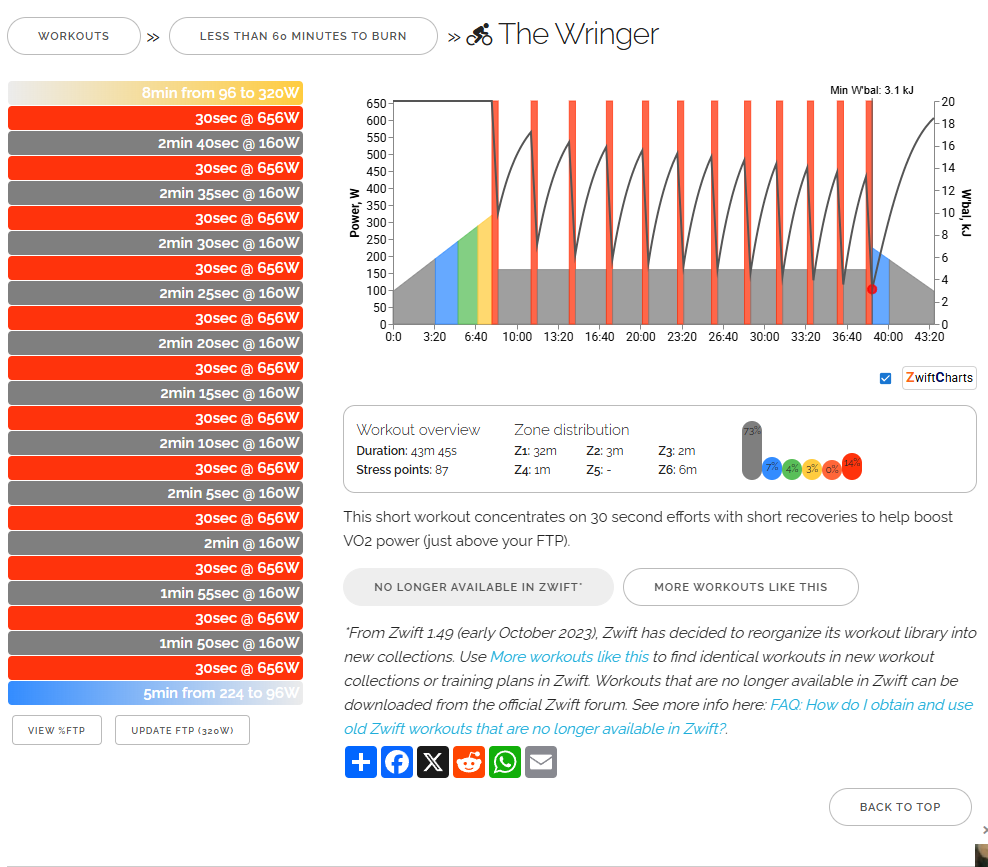
ZwiftCharts does a few things to these workout charts:
- Replaces the default workout chart with an interactive one (mouse over the bars to see watts targets and Kj)
- Overlays a W’bal chart
- Reveals the minimum W’bal value specific to each workout
As Max at ZwiftCharts says, “Understanding W’bal data is crucial for estimating the feasibility of a workout (assuming your FTP is correctly set).” It also helps to tell you just how deep you’ll be digging to complete the workout!
Questions or Comments?
Like many browser extensions, ZwiftCharts simply takes available information from a page but presents it in more useful ways. I’m keeping it installed, because I love the ZwiftPower graphs! Nice work, Max.
What about you? Do you use ZwiftCharts? How have you found it useful? Share below!

Love this!💪🏻
Fantastic to see some stats there I’ve wondered about. Am I right in reading it as saying roughly 2/3 ZwiftPower users are C or D cat? I’d expect that ratio to be even higher among non-racers.
Not really, as that was event up to 700 racing score, so you’d have to take a look at something like Tour de Zwift sign-ups for a better representation of a whole population.
Not for Firefox? Shame
Agreed quite a narrow effort, was it pushed by some Google dev team?
My question is, where can I change the value of W
for ‘WhatsOnZwift’?Max’s statement:The default 20kJ is abstract.
And in this form, without the possibility to change W
‘- Reveals the minimum W` bal value specific to each workout’ will absolutely confuse the grey user. He might even fall into complexes of not being able to ‘do the workout properly’ 😉
W’bal levels is an interesting thing that I’m not sure gets illustrated anywhere on Zwift unless it’s what’s hidden under “3/5🔥”
You can have W’ plotted during your ride using Sauce for Zwift (on a PC or Mac).
sure but that’s real time, not projection like it is here
If you want it in the analysis you can get it in Sauce for Strava. But yes, for considering which workout you want to do, it can be useful, and now you can use the Zwiftcharts/Whatsonzwift combo to achieve that. Would be better to find it in Zwift, but I don’t think that’ll happen soon.
I like the HR vs power chart. Have started years ago to monitor, since it gives much better insights about form & spots to focus on.
Thanks, very useful. One thing: Is it possible to display the stats only for one category in a race, that is A or B and so forth? It seems as if it pulls the data from all categories though you opt to have only one displayed.
Got it on Edge, would have preferred Firefox but what a great tool.
What a great tool it really adds to the interest.
This is very interesting, but I wish it worked on the League pages – e.g. analysing the General Classification results across the Zwift Monthly Racing series, or the TT club (not that there are time slots that I can ride any more!!!).
The larger populations in the League GC would be fascinating, and more statistically valid, assuming the data visualisations could handle it.
Perhaps an opportunity for additional functionality?
Lol just further proof big fat ass clydsdales like myself shouldn’t even spend a dime on zwift. My average ride of 175-200 watts doesn’t even make the datasets at 155kg….ha
In ZwiftPower ZwiftCharts appears to be using the old w/kg categories (referred to as pace group), not the ZRS categories, which is very confusing. As a result you can’t analyse the results for your race, since the ZRS categories often span two or three of the old w/kg categories. I was looking at a recent race of mine and couldn’t understand why there were 10 riders in ‘D’ when there should have been 30 … then I worked it out.
I would definitely use this if you could filter by the actual ZRS race categories, but I don’t really care about comparing myself to riders who may or may not have been in my race. Oh well.
Hi.
Is it also running with Safari?