We are back for the 3rd of 4 installments on “How to Become a Top Category Zwift Racer” series! Check out the Cat B and/or Cat C articles if you missed them. This one combines A+ and A because these racers have similar power output and race in the exact same races.
So, if you’re looking to be one of the top A and/or A+ racers in Zwift, here is what you need:
- Race Experience: These people race a lot and get very good at it. Zwift is a skill.
- Draft Master: The top flat races are almost always won with under 4.7 W/kg average for the winners.
- Top Level 15-Second Sprint Power: 13+ W/kg
- Excellent 1-Minute Power: To get yourself in position to unleash your huge sprint, you need to be able to put out a lot of power in the last 1-2 minutes of the race. This is the main thing that stands out between the typical A/A+ rider and the top-ranked A/A+ rider.
- Good Enough 20-Minute Power: These people can put out good 20-minute power, meaning enough to sit in the group without feeling wrecked. But you don’t need to be a 5.5+ W/kg monster to compete.
- Rank Hunting: This group races each other constantly to improve their ranking. Many of them also get invited to the invitationals, further helping their ranking. You absolutely cannot get into these rankings without racing in the weekly races where these people show up in en masse.
- Profile Picture: Check out the details at the end if you are an aspiring top rider. Perhaps you just need a picture of you wearing a jersey? The data doesn’t lie.
All of the data below is based on the top 50 in both the A+ and A categories and only includes races where the rider was “trying”. See the end of the article for methodology.
Note: Since I pulled this data, the top ranked A+ racer’s results were removed. That racer’s data is included in the analysis below because his/her power was in line with everyone else, I already had most of this written, and… I’m lazy.
If you’re curious about the specific data I used, check out all the data details at the end of the article. Otherwise, let’s jump into it…
Category A vs A+: What’s the Difference?

To qualify as an A or A+ racer, you need to achieve the following 20-minute power:
- Cat A+: 4.84 W/kg and 315 Watts and above
- Cat A: between 4.21 W/kg and 263 Watts and A+ limit
As a reminder, the wattage and W/kg numbers above are 95% of your best 20-minute power during a race, hence they are actually higher than the numbers listed.
As we are all aware, weight plays a large part in this, so let’s take a look at what that means for the maximum W/kg without exceeding the 315 watts that would move you to category A+. As you can see below, 65 kg is where you hit the 4.84 W/kg / 315 Watt limit.

Before we dive in, let’s take a quick poll:
If you compare the two Zwifters below, which one do you think is better? Which one do you think is A+ and which one is A?
Rider 1

Rider 2

Well, Rider 1 is Joakim Lisson, the 9th ranked Zwifter in all categories, who also falls into Cat A. Rider 2 is A+ and is a fantastic rider and I aspire to have any one of those numbers; don’t get me wrong. But it is strange that Lisson would beat him in nearly all major Zwift races (save races with climbs well over 5 minutes) and is in a lower category.
If you look at many of the A+ riders, they have not exceeded the 4.84 W/kg I mentioned above in the last 90 days, yet they stay A+. Why? My guess is that ZwiftPower is keeping some of these people A+ because they know it would look weird if the very top person is an A and not an A+.
This all leads me to what I believe is the biggest Zwift racing myth: “Zwift racing is only about who has the highest W/kg and that person wins every time.”
The data not only contradicts this, but also highlights the fact that we need a new racing categorization method. Zwift is a complex game of strategy, timing, and knowledge. Look for my next article which will focus on this specifically. Until then, let’s dive into some other metrics comparing A vs A+.
The Numbers Breakdown
Let’s start with a basic comparison of the different groups:

Raw 20-Minute Power
Unsurprisingly, the A+ riders average a higher W/kg than the A. However, the difference is not as large as I would have guessed.
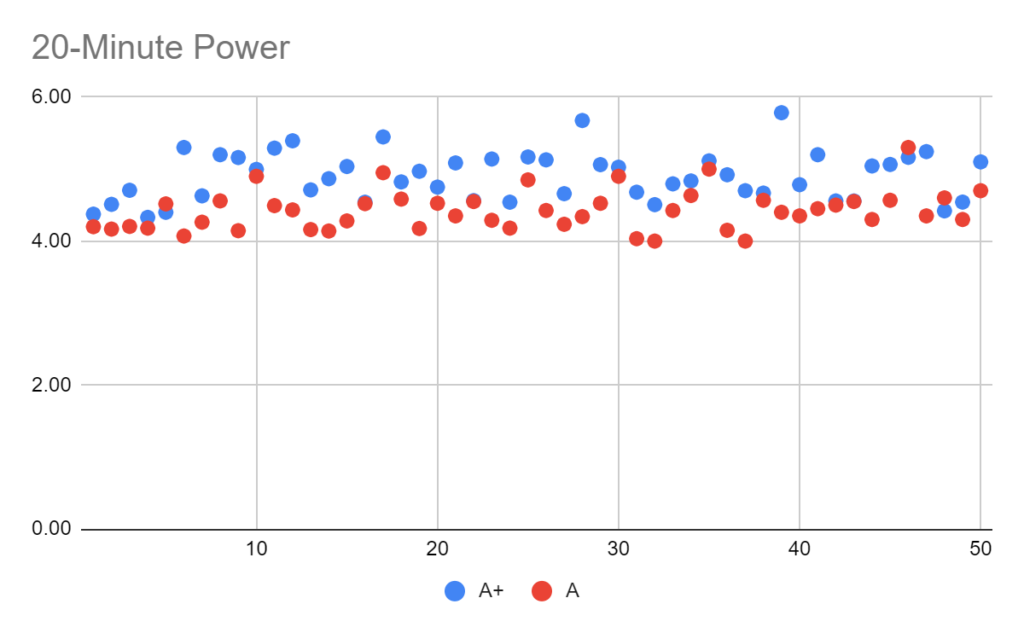
Remembering that this is race data and not all-out 20-minute power, I think this reflects that these riders are all racing in the same flat races so it makes sense they would all be grouped.
The high-end outliers are mainly people who get into the invitational races and are able to hammer on the queen stages up the mountains.
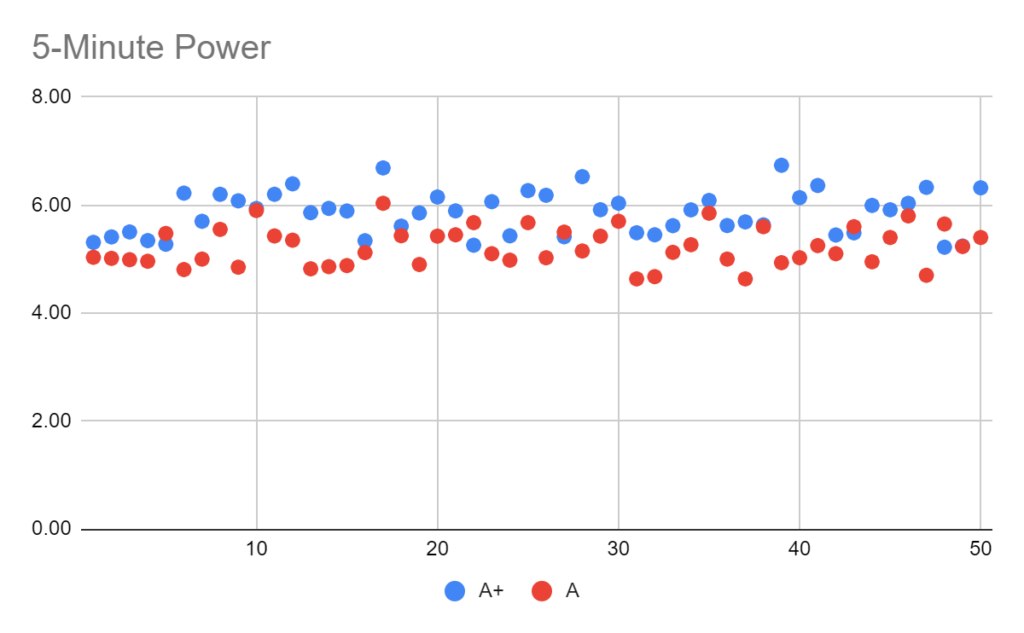
5-Minute Power
This data basically mirrors the 20-minute power and all the same comments apply. These riders are rarely racing events with 5-minute climbs, and when they do they’re rarely going to ride up it as hard as they can.
1-Minute Power
This is where it starts getting interesting and we separate the wheat from the chaff, and Lord knows, I’m a big wheat and chaff guy.
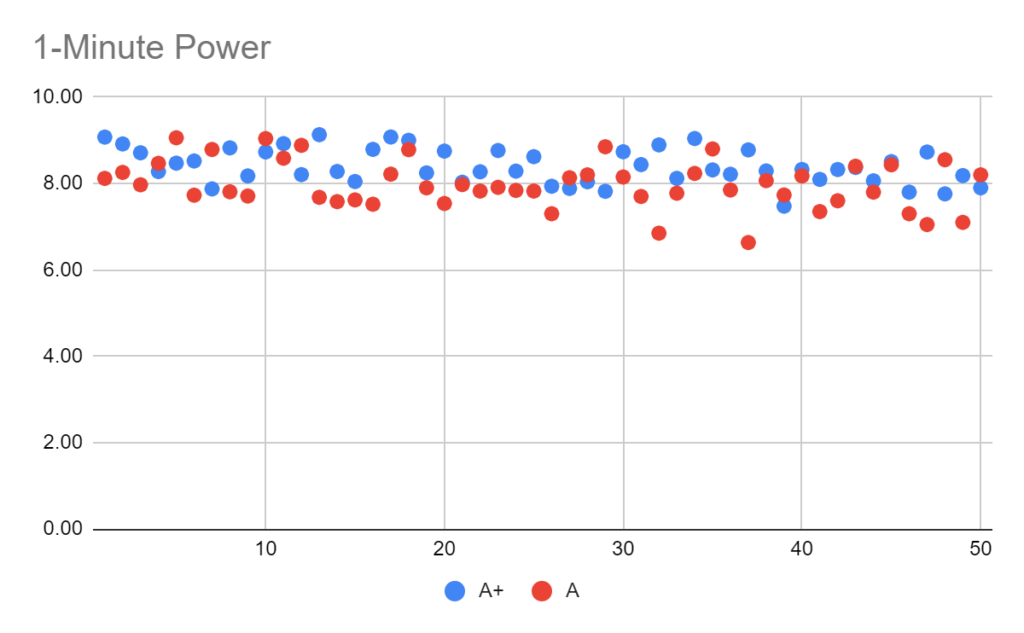
Look at those numbers! These guys are absolutely flying the last minute or two of a race. Based on my Cat B article I decided to race in a couple large A races to see if I could get my ranking down, and I can confirm that in these big flat races with these top guys the last 1-2 minutes is where those of us with “normal” power get ridden right off the back. I was able to hang for the first 30 km of the race, but the last 1 km they just rode away.
Notice there is basically no difference or outliers amongst the data between Cat A and A+. This aligns to the ZwiftPower category methodology I outlined in the beginning Category A vs A+: What’s the Difference?
What does this mean? If you want to get into the top 50 in Cat A or A+ you need to be able to put out huge power for the last minute or two of a race, and then you need to…
15-Second Power
…be able to bump that up even higher for the last 15-seconds! Just take a look at the graph below.
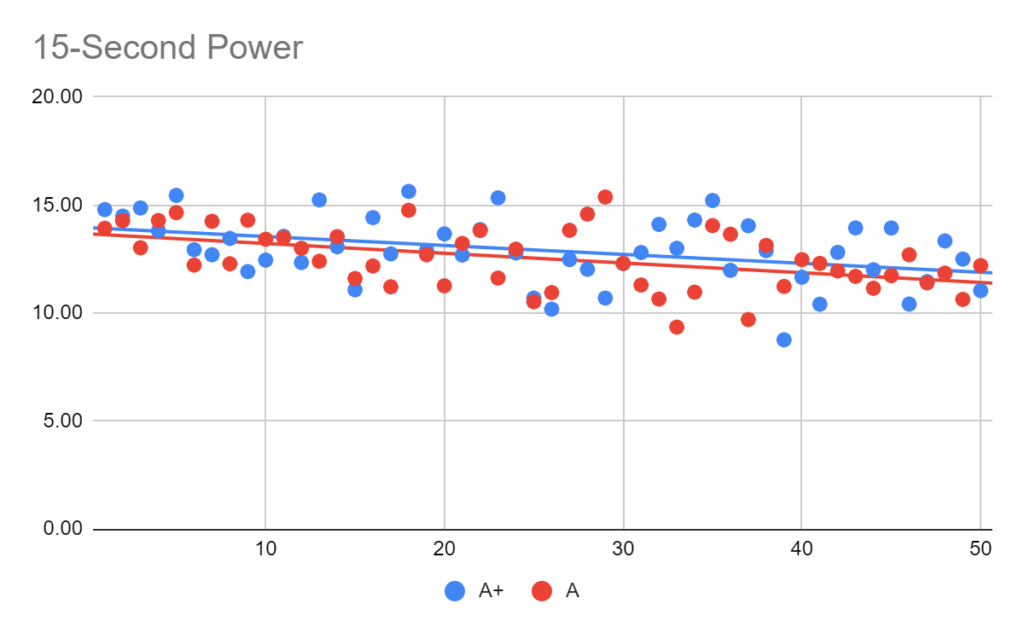
If you want to be the best you need to be able to put out 15 W/kg at the end of a race after putting out 8-9 W/kg for the last minute of the race. That’s the main difference between these racers and the other people. There are others that can put out 9 W/kg for a minute, but they don’t have a sprint and get killed in the last 15 seconds. And there are people who can put out 14-15 W/kg but can’t make it to the line close enough to use it. (Just take a look at the recent invitational results to see what I mean.)
Percentage of 20-Minute Power
Below is the data as a percentage of 20-Minute Power illustrating the differences between categories:

Because the Cat A+ riders have a higher average 20-minute power, and there is no arbitrary upper bound like other categories so they have lower percentages using this metric.
Cat A continued the trend of Cats B and C where the percentage of 20-minute power increased from category to category. Is this evidence that there is more “sandbagging” as the category increases? Maybe. But you know that saying in poker “If you can’t spot the sucker in the room then you are the sucker?” I think the same is true here: “If you have the highest W/kg in the race, then you are the sucker.” The goal of these races is to win, not to prove you have the highest FTP and get outsprinted. The Heart Rate data below helps prove some of that as well.
Back on my soapbox for one more minute…I think this also backs up the need to redo the categories.
Percentage of Max Heart Rate
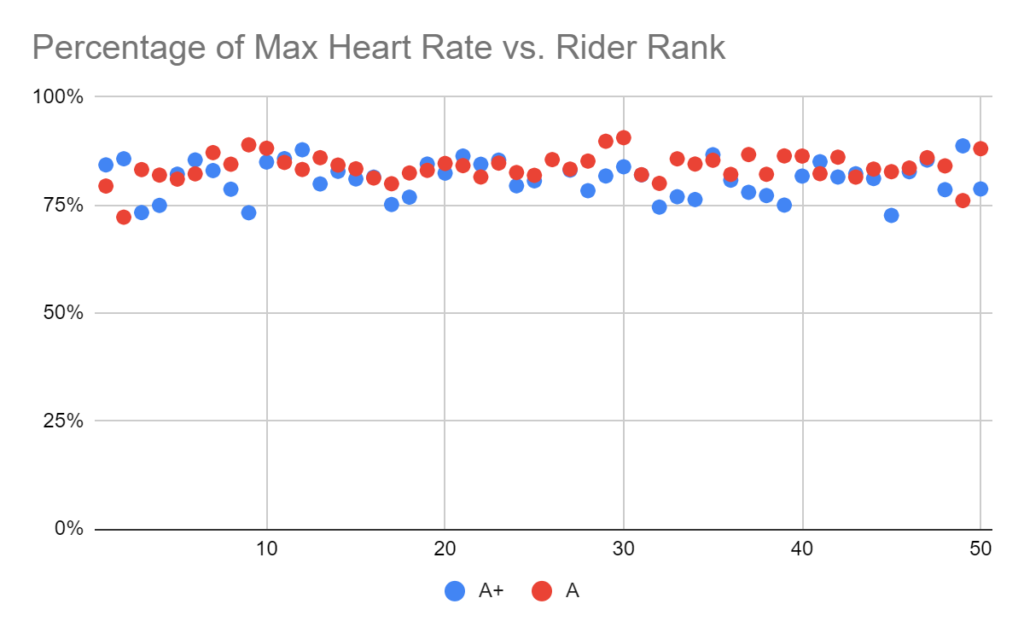
Everyone falls between 72.2% and 88.7%. Seems very straightforward, and not many people are accusing the A+ and A guys of sandbagging.
Races Per Week
I said in the beginning that A and A+ racers race a lot. Check out my hero below!

I had to double-check to make sure that was right because it’s such an outlier: 11.6 races per week!
The average for both categories is 2.6 races per week. That’s a lot of racing. I am guessing this average will be higher in the Northern Hemisphere winter as this number is skewed down by some of the COVID pros who just came on during the pandemic and raced the big invitationals.
Podium Percentage
Since these people race against each other all the time, I was surprised to see just how high the podium percentages were for them:
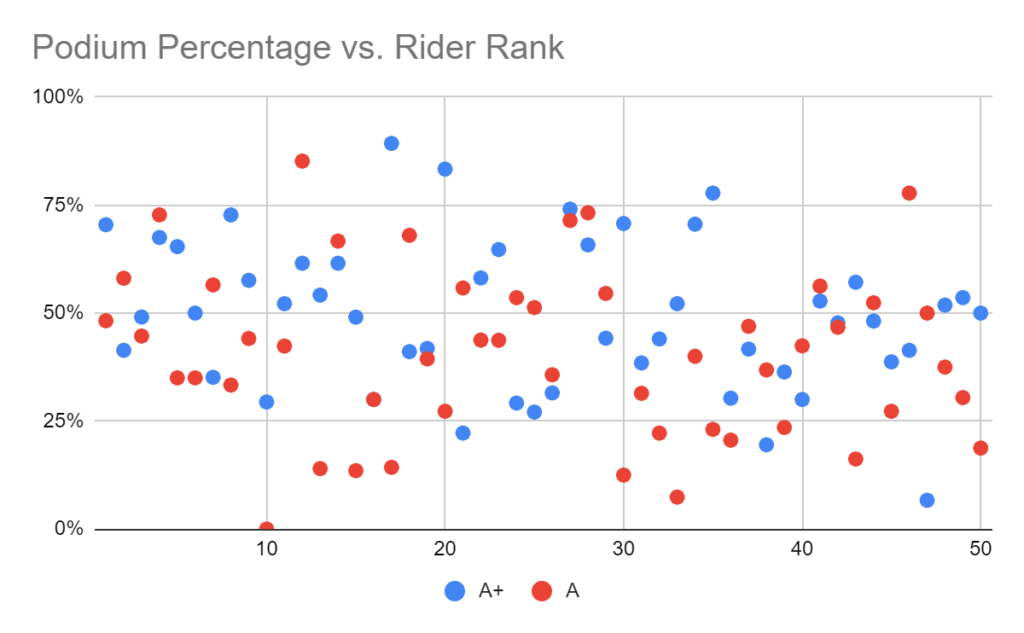
Cat A+ averaged a podium spot 48.8% of the time and Cat A 42.1%. This is also skewed a little low from those same COVID pros who only raced invitationals, where podium spots are harder to come by.
I think this shows that these people probably split the larger fields with around 40-50% normal community races. One of my favorite things about Zwift is that sometimes when you don’t expect it, someone like the 2019 US National Champ will show up for your race. How many other sports or esports can claim something like that?
Other Tidbits
Rider Weights
I was a bit surprised by the range of weights. The average is 70.1 kg across both groups, with the maximum weight being 90 kg and a minimum of 49.3 kg.
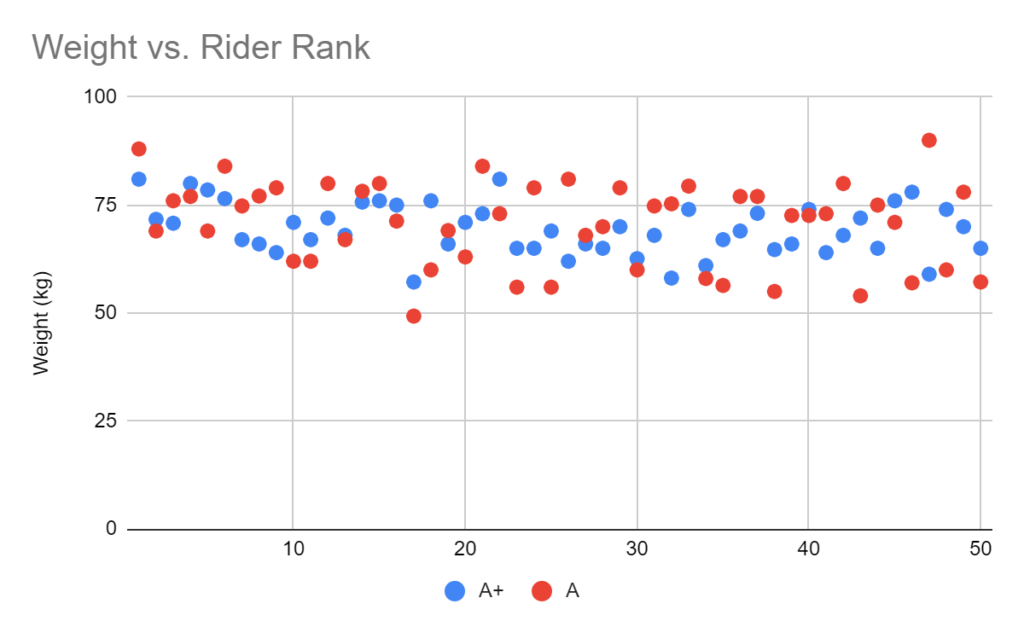
So I decided to also plot out all 100 of these people (both categories) with their W/kg vs. Weight:
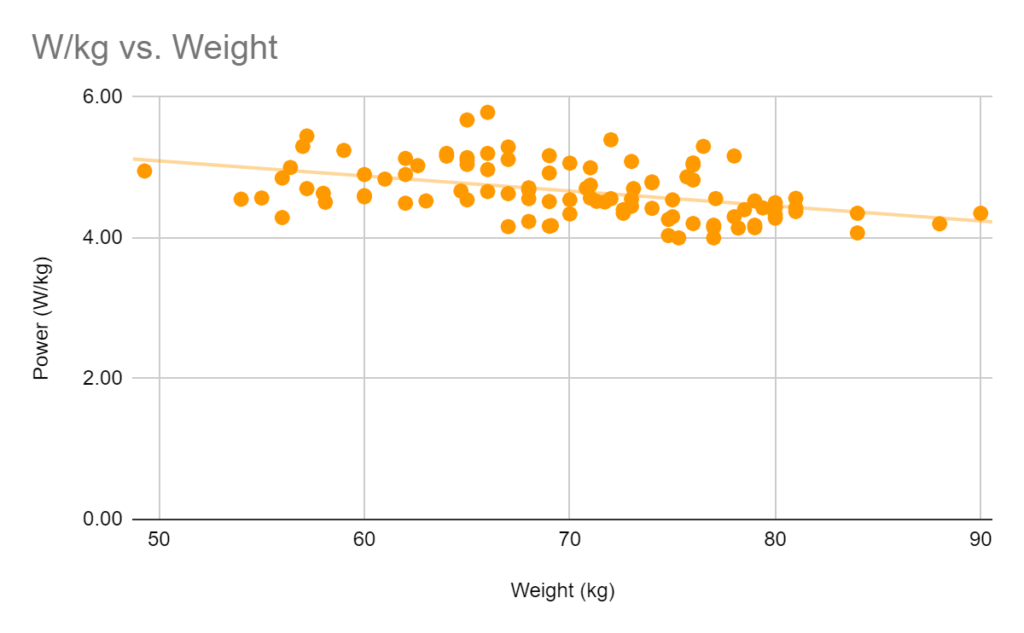
There is a 19.2% correlation between weight and W/kg which I think tells us that Zwift has a wide range of riders. The main attribute is fitness and making sure you can hang with the group and sprint at the end.
Fake Names
4 of the Cat A riders had fake names. One of the A+ had a fake name, but he changed it since then.
Rider Ages
The best A+/A riders span all ages. See the distribution below:

*Note to 50+ riders: We are all envious of you.
Rider Locations
These riders predominantly come from Europe, followed by North America, then Oceania and South America.

Disqualifications
A+ riders were DQ’ed 0.96% of the time, A riders were DQ’ed 0.71% of the time. A+ was skewed by one guy getting 48 heart rate DQs. I removed him from the data.
Profile Photo
I tried to write code for image recognition software to read through every user page on Zwift Power, but it turns out I don’t know how to code. Alas, I just manually clicked on each ZwiftPower link and created my highly scientific graph below.

Based on this very mature statistical model, it looks like using a picture of yourself in a jersey riding a bike can get you closer to being one of the top 50 A+ or A riders. If that’s not possible, try just wearing a jersey and looking at the camera; there was no correlation between crossed arms and having your arms on your hips or between smiling and looking serious.
Also, for all of you who have torn yourself apart trying to decide between the normal human headshot or a photo of food (dessert): surprisingly, there seems to be no appreciable difference between the two in terms of your ability to attain a good ZwiftPower ranking. However, it will double your chances of achieving a better rank when compared to flexing your muscles, either on the bike or wearing a tank top.
The Data Details
- Data Source: ZwiftPower
- Data Curation: Manually downloaded. I would love to pull more data and do other analyses (see other articles I’m planning at the end) but I haven’t found an API to download all of the data from ZwiftPower. (People who run ZwiftPower – I feel like you are ignoring me at this point).
- Data Filter(s): Past 90 days of racing from the Top 20 category A and A+ racers as of August 17th. When you look at the rider profiles you will see higher power than what is shown below because the data I used is only from races where the rider achieved a rank of under 150 for the race ranking. Our goal is to identify how to become a top Zwift racer, not to see what everyone’s max wattage is during a 2.0 W/kg group ride with a sprint in the middle. Cutting off at 150 is arbitrary. Looking at the best five races from the racers between 40th and 50th for each category seemed appropriate.
- Analysis Tool(s): Google Sheets
Next Articles and Projects
Below are additional articles and projects I working on:
- Zwift Racing Tips and Tricks YouTube Channel – Coming Soon!!!
- Zwift Rankings and Category Improvements
- Women-Specific article
A huge thank you to everyone who read the last articles and provided feedback. I really appreciated every single comment and tried my best to respond to everyone.
Let me know your thoughts on this article and ideas for future articles in the comments below!
Good Luck and Ride On!