Your chosen bike frame and wheelset both affect speed in Zwift, so it makes sense for racers to do a little research and choose the best tool for the job. This is especially important in a time trial (TT) race, since there is no drafting and all your speed is entirely dependent on you and your bike!
While Zwift’s 4-star rating system for weight and aero is simple and easy to understand, performance varies even among frames with the same star ratings, because the stars are just an approximation. On top of that, Zwift’s addition of bike upgrades means racers need to take into account how a frame will perform when fully upgraded, not only when it’s first purchased.
Therefore, we’ve created several charts ranking all the TT bike frames based on their performance on flat roads and climbs, in un-upgraded and fully-upgraded states.
If you’re just looking for recommendations on what to buy, here are some helpful posts:
Table of Contents
Charts last updated June 10, 2025
Time Savings Over 1 Hour (Stage 0 Frames)
We begin with a simple chart showing how much time a particular frame will save you across 1 hour of riding at 300W (4 W/kg) compared to the most basic TT frame in game (the Zwift TT). These are “stage 0” frames, meaning no performance upgrades have been applied.
The chart is sorted from the best-performing frames to the worst, and you can sort based on flat performance or climb performance.
Sort Chart By:
Takeaways
When sorted by flat performance, you can easily see that the bottom ~10 frames have similar CdA (aero) settings in Zwift.
If you sort by climb performance, the speed falloff from one bike to the next is more even across the board. (This applies to road bike frames as well.) While Cadex Tri is far and away the winner on flat ground, it drops down in the list when it comes to climbs, meaning a pure climb TT needs a different weapon than a mixed or flat race on Zwift.
Time Savings Over 1 Hour (Stage 5 Frames)
This chart is just like the one above, except these are “stage 5” frames, meaning all possible performance upgrades have been applied.
Read all about Bike Upgrades here >
Use the toggle to sort based on flat performance or climb performance.
Sort Chart By:
Takeaways
We shouldn’t see any major rankings changes here in terms of flat or climb performance, since all frames receive the same upgrades between stages 0 and 5.
Except there’s a bug (see “Misconfigured Frames” below), which means the Cervelo PX-Series and Ventum One both drop several slots between stage 0 and 5 in terms of flat performance, while improving more than the other frames in climb performance.
Apart from the misconfigured frames, all other frames gain roughly the same performance improvements between stage 0 and 5. (This test data has a margin of error of approximately 1 second, so you’ll see the frames reshuffled a bit due to this.) That performance improvement is almost 50 seconds on the flats, which is huge in a TT!
Time Savings, Stacked (Stage 0 vs Stage 5 Frames)
Next, we have one of our favorite charts, ranking frames based on total time savings across our flat and climbing tests. This chart lets you easily see the best all-around performers, and whether their performance leans to the aero or climbing side.
Use the toggle to see data for stage 0 frames, or fully-upgraded stage 5 frames.
Show Chart For:
Takeaways
There are clearly four top TT frames in terms of all-around performance: the Cadex Tri, Scott Plasma RC Ultimate, Felt IA 2.0, and Canyon Speedmax CF SLX Disc.
Time Savings for Climbing (2 W/kg vs 4 W/kg)
Some readers have asked us to compute time gaps at lower power numbers, which is a perfectly reasonable request. Making this change has the interesting effect on climb times of making lightweight bikes move up the rankings while the more aero-focused bikes drop.
This is because, as you reduce your climbing speed, having an aero bike delivers less benefit.
Below we’ve charted climb time gaps for both 2 W/kg and 4 W/kg, and you can toggle between those two power levels to see how the rankings change. (The 2 W/kg time gap is compared to the Zwift TT frame at 2 W/kg, while the 4 W/kg time gap is compared to the Zwift Carbon frame at 4 W/kg). Times given are for stage 0 (un-upgraded) frames.
Show Chart For:
Takeaways
The top 5 climbers remain the top 5 climbers whether you’re riding at 2 W/kg or 4 W/kg… but they get reshuffled a bit.
Misconfigured Frames


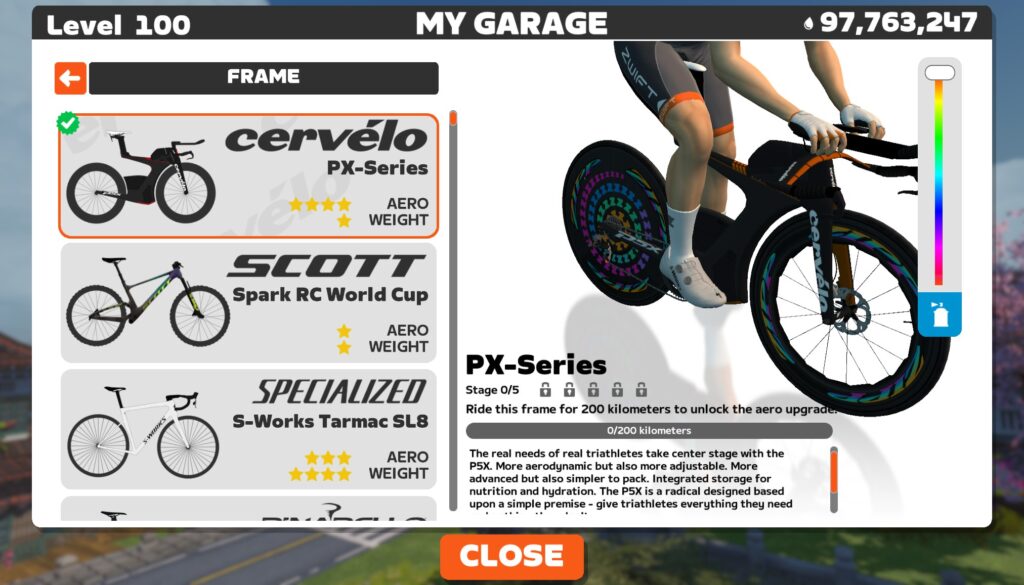
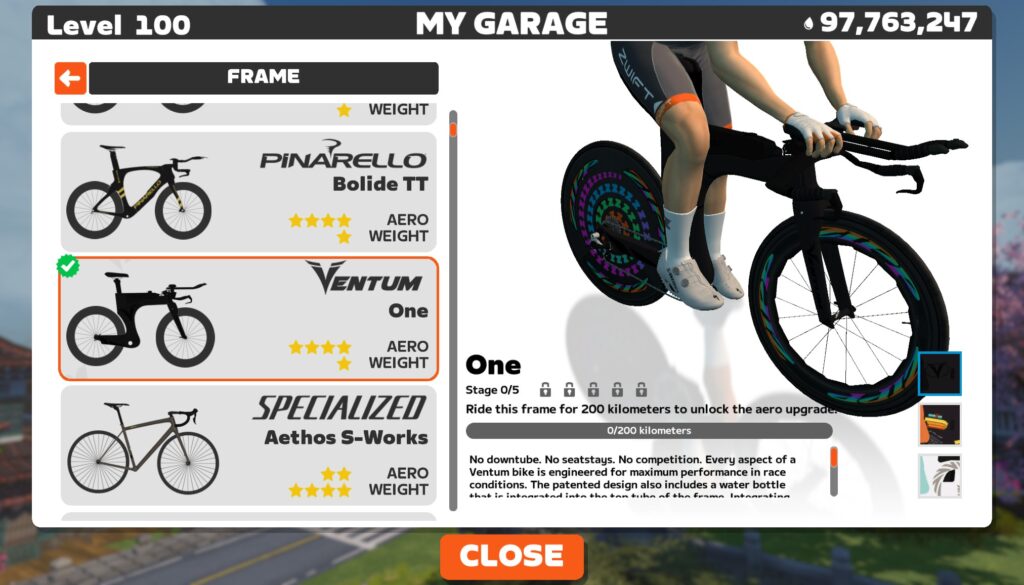
All of the TT frames on Zwift are supposed to be using the duration-based upgrade scheme. But for whatever reason (we assume it’s a misconfiguration), Zwift has configured the Cervelo PX-Series and Ventum One as distance-based upgrades, like standard road bikes.
This means that the upgrades applied to these frames as you progress from stage 0 to 5 are different than the upgrades applied to other TT frames. The end result? As mentioned above, the Cervelo PX-Series and Ventum One improve a bit more than their peers in flat performance between stage 0 and 5, while losing a bit in climb performance.
What About the Espada?

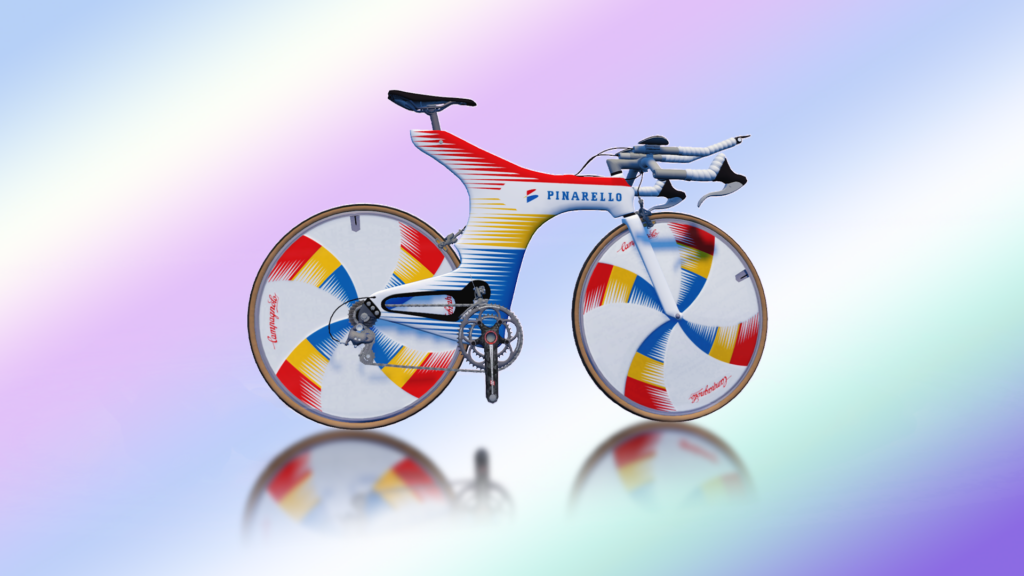
The Pinarello Espada is the only TT Halo Bike currently in Zwift. It is not listed above because it’s impossible to test the Espada frame without also testing the Espada wheels, since they are inseparable.
The Espada, it could be said, performs like a top-quality TT frame from the 1990’s. It loses ~20 seconds to the fastest TT frame in game (the Cadex Tri paired with Zipp 858/Super9 wheels) across an hour of flat riding, while losing around 15 seconds on an hour-long climb to the Cadex (which isn’t even close to the fastest climbing frame in game).
Testing Methodology
The data above was generated using our standard bot testing procedure. Our bot rides alone on Zwift, set to 75kg weight, 183cm height, using the Zwift 32mm Carbon wheels. The aero (flat) test route is Tempus Fugit, the flattest course on Zwift, while the weight (climbing) test is done on Alpe du Zwift since it’s a long, steep, and fairly steady climb.
All of the data used by these charts comes from our public Google sheet of test data.
Questions or Comments?
We’d love to know what you think of these charts, including suggestions for improvements. Share your comments below.
