As explained in my introductory post, this season I’ve decided to jump into bike training with a personal coach. Due to a variety of circumstances I haven’t gotten around to posting my monthly progress reports, so now it’s time to play catch-up!
Here’s my report for February, my first month of training with Shayne Gaffney of GC Coaching.
Where I Began
Note: Shayne uses TrainingPeak’s WKO4 software to analyze ride data, and it’s quite an amazing tool. The screenshots and data I’ll discuss here generally come out of WK04.
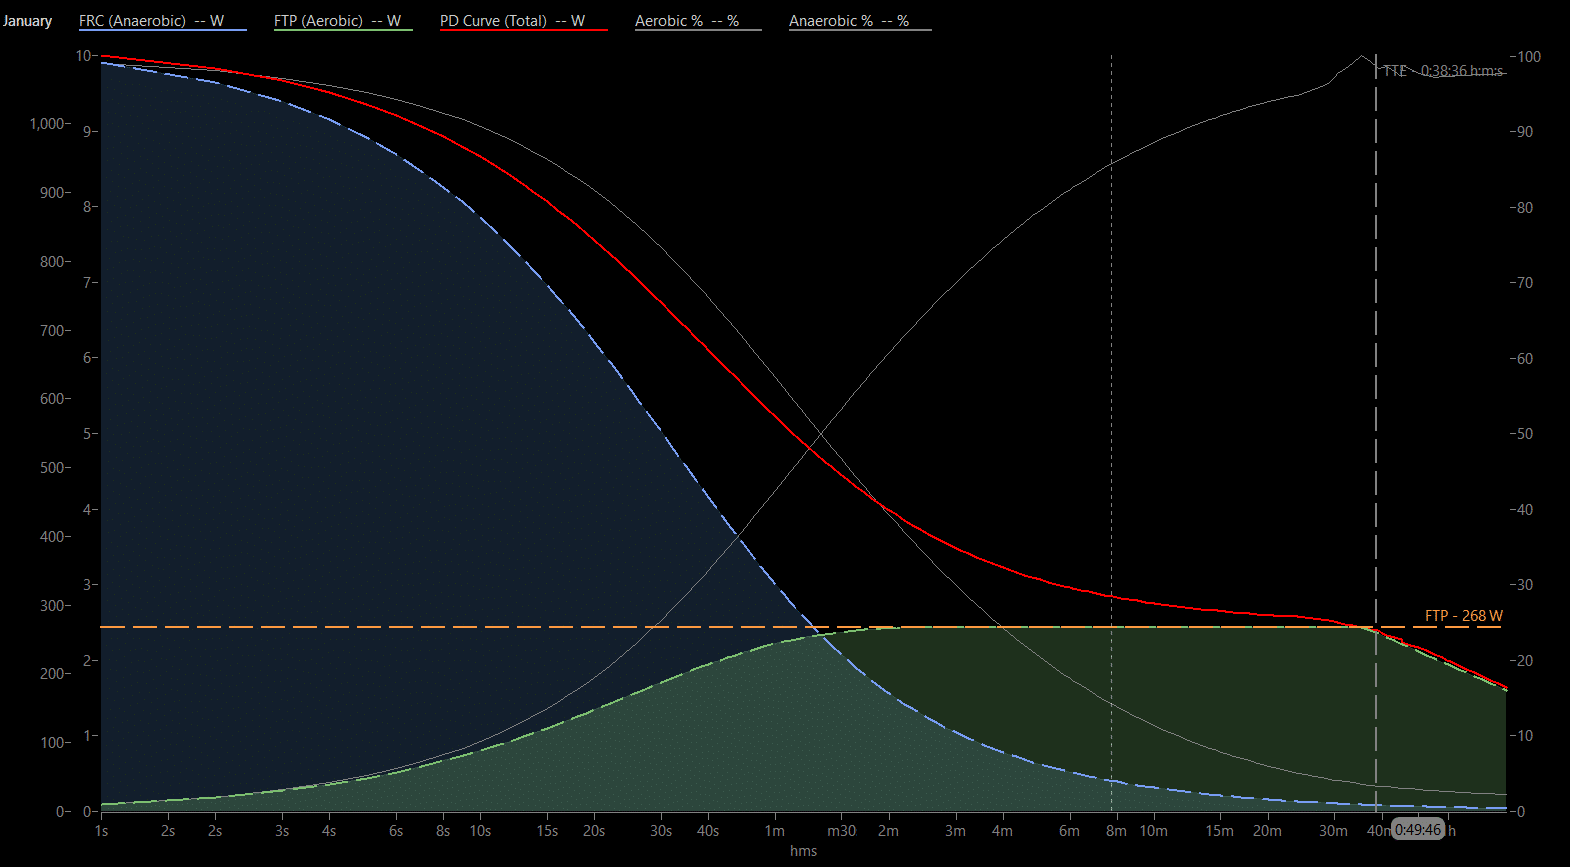
After feeding my January 2019 ride data into WK04, Shayne was able to calculate my pre-training program modeled FTP and time to exhaustion. Here’s what my chart looked like:
Shayne told me:
This image represents your FTP contribution from January. FTP is comprised of your aerobic + your anaerobic metabolic system. So, during the base phase you want to see a higher contribution from the aerobic system, and a lower contribution from the anaerobic system. FTP trended at 268w for January.
The Workouts
Based on my goals and current weak spots (see the intro post for those) Shayne had me doing a lot of VO2 and Sweet Spot Training (SST) intervals on my “hard” days. He placed my workouts onto my calendar at TrainingPeaks, where I could view what’s coming up. Each day’s workout automagically showed up in my Zwift workouts list, so I could hop on and hit it whenever I was ready.
Here’s the first workout Shayne gave me:
This is a VO2 interval workout, 4 sets of intervals where I held 118% of my FTP for 40 seconds, then rested for 20 seconds… repeating that 6 times for each set.
When I saw the workout I was concerned about how fatigued I would be for the next day’s Zwift race. I was just starting DIRT’s Morning Grind Fondo series, which happened every Wednesday for 12 weeks. Shayne didn’t seem too concerned about the fatigue issue though, so I went with it. And guess what? I felt fresh for the race (see it on Strava)… Zwift even said my FTP had bumped up (from 295 to 299).
This was the first of many times that I realized Shayne actually knows what he’s doing, and the numbers don’t lie. As a coach he has the ability to look at my data and a block of training and figure out where I’ll be fatigued, where I’ll be fresh, etc. And he is impressively accurate.
Here’s another example of a typical workout Shayne had me doing in February. Lots of Sweet Spot work.
In February our workout pattern basically looked like this:
- Monday: core workout, no ride
- Tuesday: VO2 work
- Wednesday: Morning Grind Fondo race
- Thursday: rest day, core workout
- Friday: Sprintapalooza ride
- Saturday: longer session with a lot of sweet spot work
- Sunday: more sweet spot work
Ride Hard, Rest Easy
Honestly, this first training block contained a lot more rest than I was used to. To be more precise: it felt like harder rides, with more rest in between.
There’s a maxim in training: “Make your easy days easy, and your hard days hard.” I hadn’t been doing a good job of that, but following Shayne’s plan ensured that I was receiving the recovery which is so key to building fitness, and when I did do a workout it was for a real purpose.
Shayne told me he typically plans training blocks in sets of 4 weeks, with the 4th week being a “rest” week where the workouts are much easier. So my final week in February was quite easy, and I’m sure my body appreciated the chance to regenerate and recover. (I also was out of town snowboarding, so that worked out nicely.)
The Results
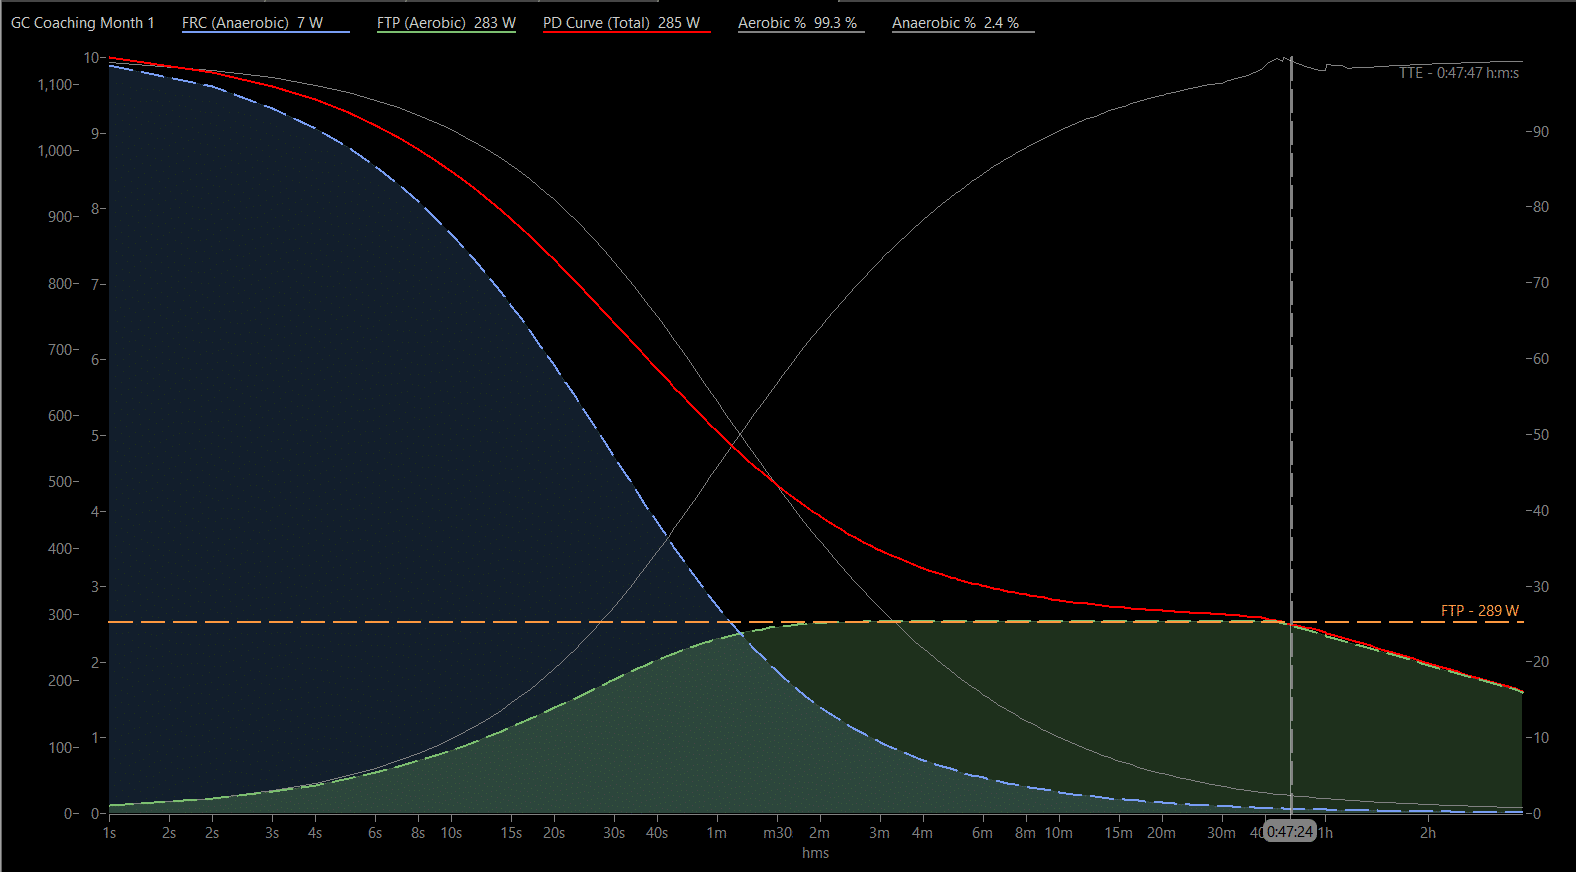
Shayne ran February’s data through WK04 and came out with an updated chart:
Here is February’s chart overlayed on January’s:
Shayne said:
As you can see, your aerobic contribution is higher generally, your time til exhaustion (TTE) has increased over 9 minutes from 38:36 in January to 47:47 in February, and your modeled FTP rose from 268w to 289w (+21w). These changes are all what we’d like to see for the base phase where we’re working on improving aerobic capacity.
Time Til Exhaustion?
This is a metric I had never dug into, so I did some research. Ready to jump down a bit of a rabbit hole?
Here’s the thing: FTP isn’t actually “the highest power you can average for an hour.” It’s also not “95% of the highest power you can average for 20 minutes,” even though that’s how Zwift typically estimates it. My Zwift-estimated FTP was 299 watts at the end of February, but my modeled FTP was 289 watts. Which was correct?
According to this article from TrainingPeaks,
Functional Threshold Power was developed by Dr. Andrew Coggan and is specifically defined as “the highest power a rider can maintain in a quasi-steady state without fatiguing.” It is an estimate of the power output that corresponds most closely with the maximal metabolic steady state or metabolic control limit, or what is more commonly referred to as “threshold.”
So what is “threshold”? From the same article referenced above, it is:
The highest exercise intensity at which blood lactate levels are stable (or quasi-stable) represents the athlete’s maximal lactate steady state (MLSS). MLSS represents the highest exercise intensity at which the rate of lactate clearance matches the rate of lactate production, and corresponds to an exercise intensity that can typically be maintained for 30 to 60 minutes, though some scientists say 40 to 70 minutes.
Did you catch that? Riding at threshold “can typically be maintained for 30 to 60 minutes, though some scientists say 40 to 70 minutes.” While most people understand FTP to be “what you can hold for an hour,” it’s really not. It’s what you can hold in a steady-state effort, and that effort is anywhere from 30-70 minutes depending on your physiology.
Although this range can be from 30 to 70 minutes, for many training athletes, it typically falls in the range of 40 to 55 minutes, which is one of the reasons why it is often associated with an hour, and why 40km (really ~40 km, since few courses are measured precisely) time trial power was originally proposed as the best estimate.
TTE is defined as:
The maximum duration for which a power equal to model-derived Functional Threshold Power can be maintained.
Based on all this information, I would say modeled FTP (mFTP) is more accurate than my Zwift-detected FTP. My mFTP increasing by 21 watts was great news. On top of that, the amount of time I could hold mFTP power increased from 38:36 to 47:47, a 9-minute increase. Double gains!
Conclusion
February was a good start, and even though I was working hard on Shayne’s workouts I was also able to place high enough in the Morning Grind Fondo series to be in first place overall by the end of the month (B category).
I’m looking forward to what next month holds. Chime in with questions or comments below!


