Recently while riding around Watopia, I noticed another rider named “Max (ZwiftCharts.com)”. Always curious about new zwifty websites, I pulled up zwiftcharts.com and discovered yet another useful Zwift community project.
What is ZwiftCharts? It’s a browser extension that interacts with ZwiftPower.com to provide post-event demographic and performance charts. It also interacts with WhatsOnZwift.com, but to a lesser degree.
While it’s been around for at least a few years, I hadn’t heard of it until recently, so I’m guessing many of you haven’t either. Let’s change that!
Installing the ZwiftCharts Extension
To install ZwiftCharts, pull up the extension homepage and click “Add to Chrome”. (You can also install the extension on Microsoft Edge.) Done!
Using ZwiftCharts on ZwiftPower
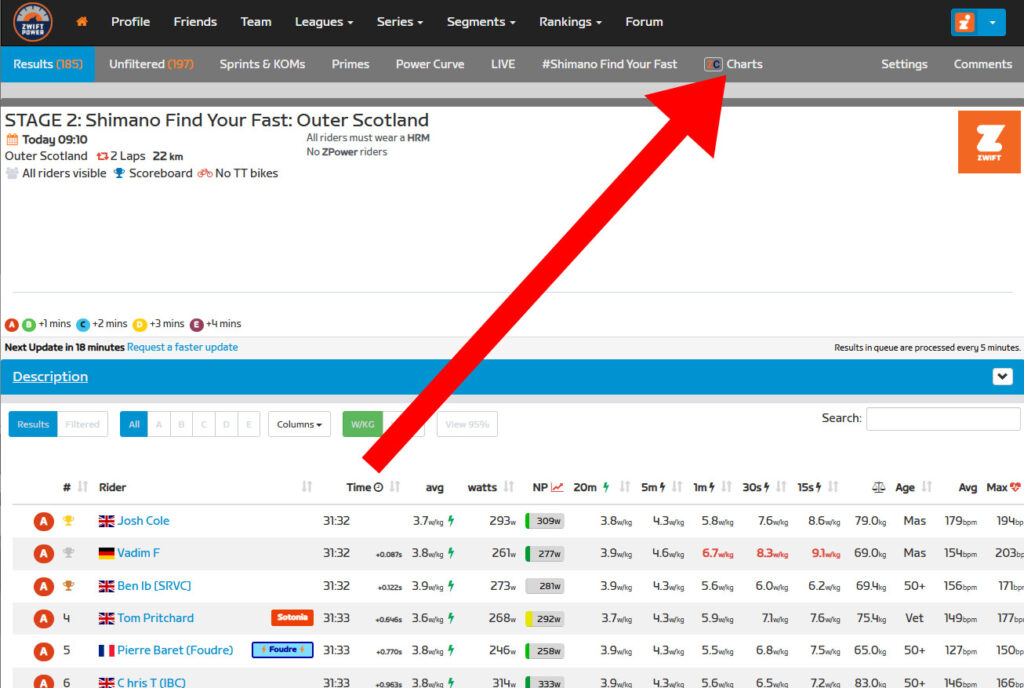
The extension simply pulls from the data already available in ZwiftPower’s event results, but displays it in useful charts. Accessing these charts is easy. Just log into ZwiftPower.com and click to view the results of a completed event. At the top of the results sheet you’ll see the ZwiftCharts button (shown below). Click that button to see all of the extension’s charts.
Related: How to Sign Up for ZwiftPower (and Why Every Zwifter Should Do It)
Here’s what is shown by default:
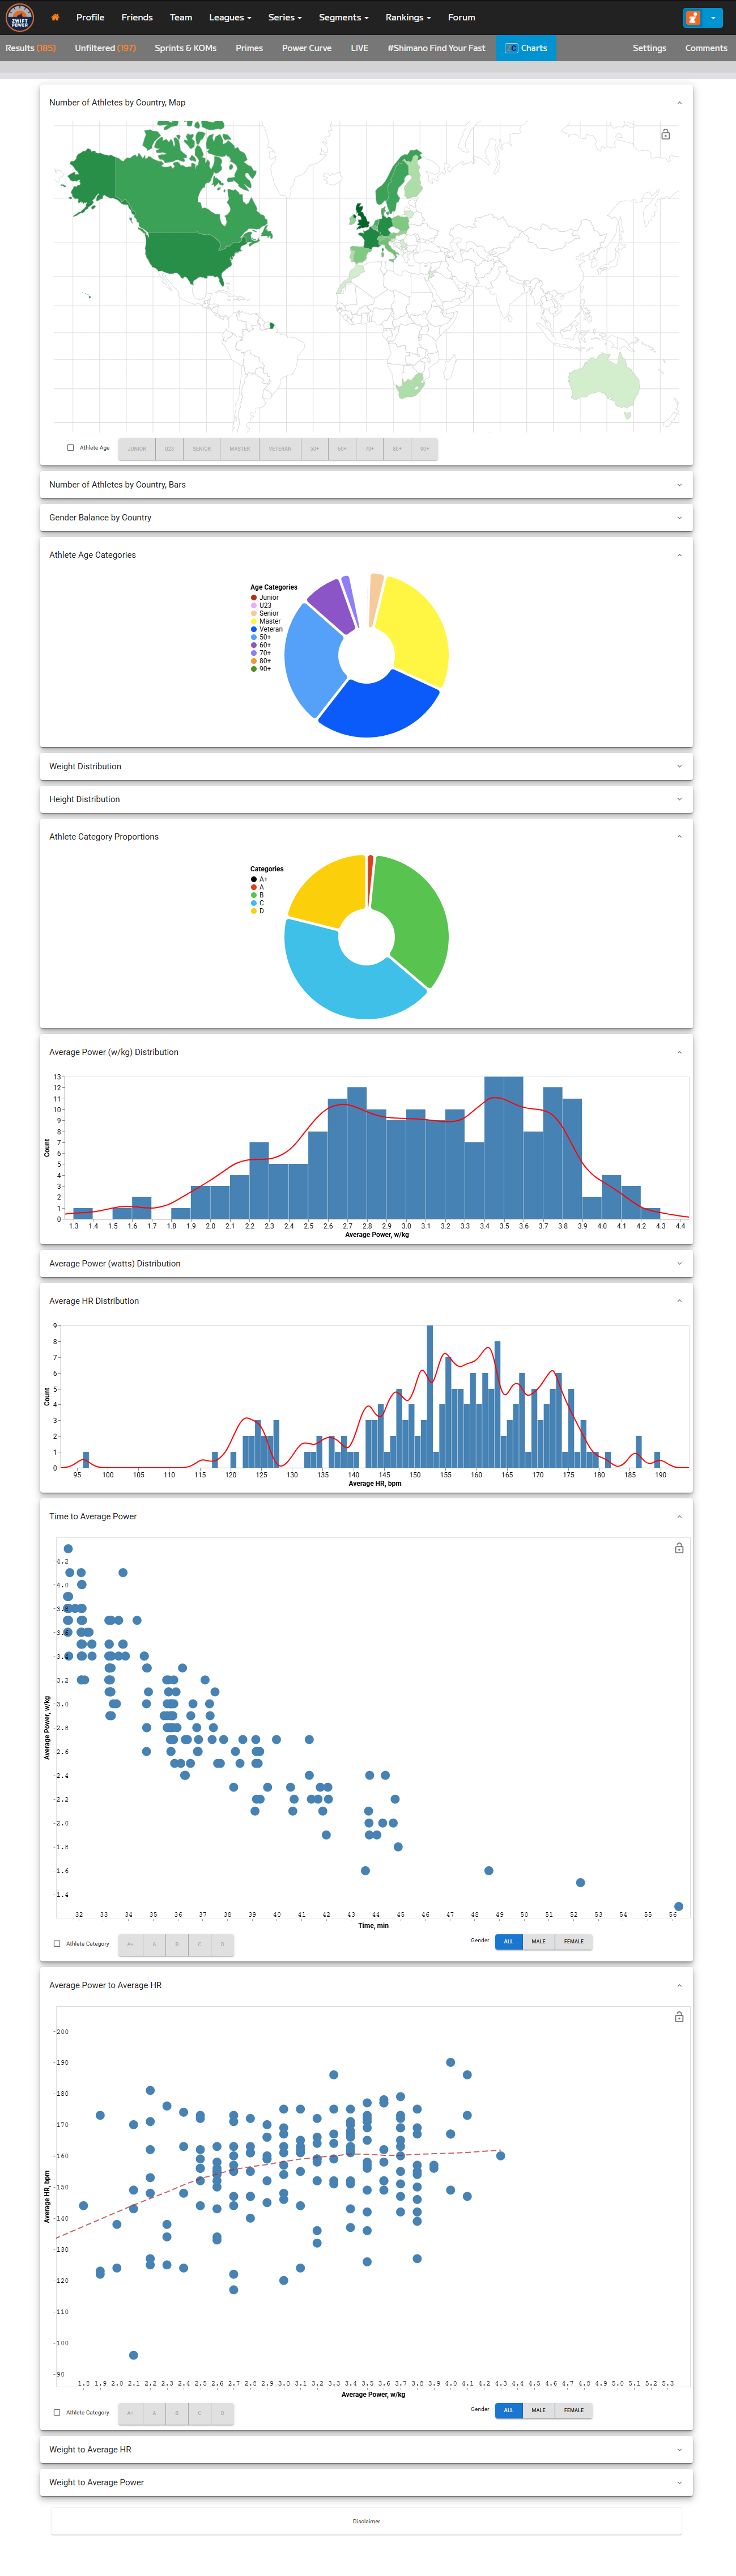
The complete list of available charts includes:
- Number of Athletes by Country, Map
- Number of Athletes by Country, Bars
- Gender Balance by Country
- Athlete Age Categories
- Weight Distribution
- Height Distribution
- Athlete Category Proportions
- Average Power (w/kg) Distribution
- Average Power (watts) Distribution
- Average HR Distribution
- Time to Average Power
- Average Power to HR
- Weight to Average HR
- Weight to Average Power
Using ZwiftCharts on WhatsOnZwift
ZwiftCharts also interacts with WhatsOnZwift to add data and interactivity to their workout charts. Simply pull up an individual workout on WhatsOnZwift, enter your FTP if needed, then click the ZwiftCharts button. You’ll see something like below, pulled from WhatsOnZwift’s “The Wringer” page:
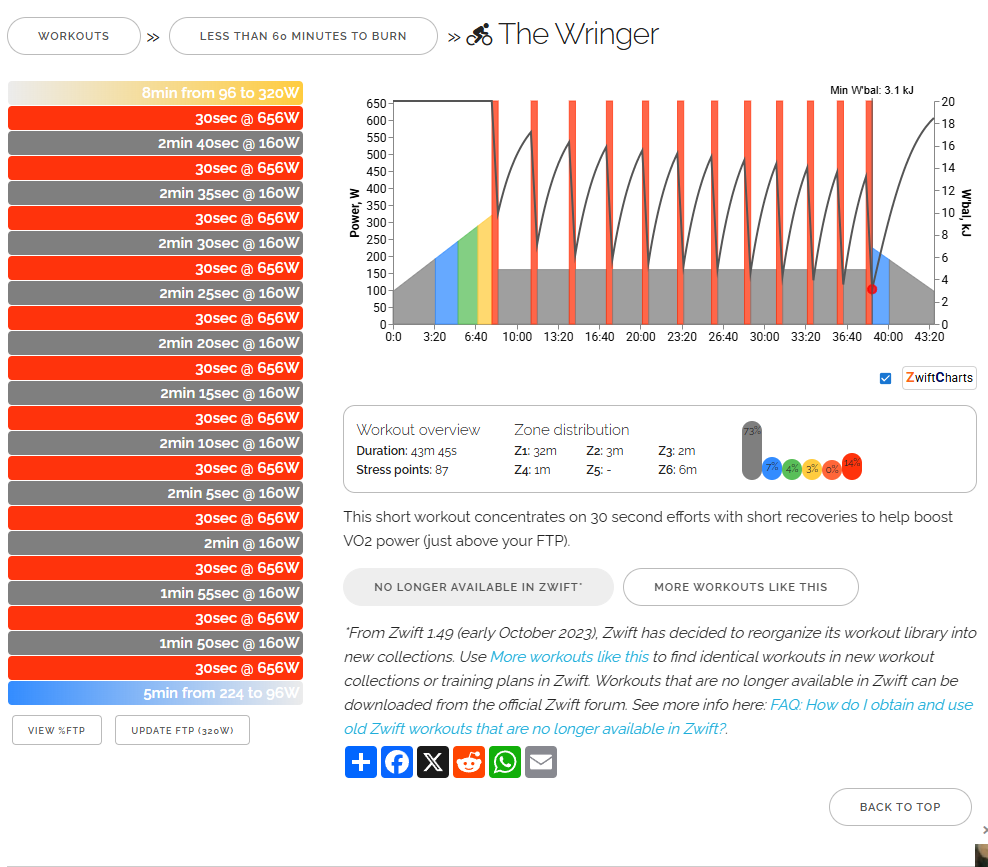
ZwiftCharts does a few things to these workout charts:
- Replaces the default workout chart with an interactive one (mouse over the bars to see watts targets and Kj)
- Overlays a W’bal chart
- Reveals the minimum W’bal value specific to each workout
As Max at ZwiftCharts says, “Understanding W’bal data is crucial for estimating the feasibility of a workout (assuming your FTP is correctly set).” It also helps to tell you just how deep you’ll be digging to complete the workout!
Questions or Comments?
Like many browser extensions, ZwiftCharts simply takes available information from a page but presents it in more useful ways. I’m keeping it installed, because I love the ZwiftPower graphs! Nice work, Max.
What about you? Do you use ZwiftCharts? How have you found it useful? Share below!
